
This article series aims at evaluating ETFs (exchange-traded funds) regarding past performance and portfolio metrics. Reviews with updated data are posted when necessary.
FDL strategy and portfolio
First Trust Morningstar Dividend Leaders Index Fund ETF (NYSEARCA:FDL) started investing operations on 3/9/2006 and tracks the Morningstar Dividend Leaders Index. It has a portfolio of 100 stocks, a 12-month distribution yield of 4.39%, and an expense ratio of 0.45%. Distributions are paid quarterly.
As described by First Trust, eligible stocks must be listed in the U.S., pay qualifying income dividends (in particular, real estate investment trusts, or REITs, are excluded), have a positive 5-year dividend growth, and a projected payout ratio below 100%. Eligible stocks are ranked by dividend yield, and the top 100 are selected in the index. Constituents are weighted based on the dollar value of indicated dividends, with a limit of 10% by constituent, and 50% in aggregate for constituents above 5%. The index is rebalanced quarterly and reconstituted annually.
The fund is mostly invested in large companies (about 68% of asset value). The heaviest sector is financials, with 25.7% of assets (about 18% is in banks). The next sectors with significant weight are energy (15.4%), healthcare (13.9%), and consumer staples (12.2%). Other sectors weigh no more than 10% individually and 33% in aggregate. Compared to the SPDR® S&P 500 ETF Trust (SPY), FDL overweights financials, energy, consumer staples and utilities. It massively underweights technology, consumer discretionary and industrials. It ignores real estate by construction.
Sector breakdown (chart: author; data: First Trust, SSGA)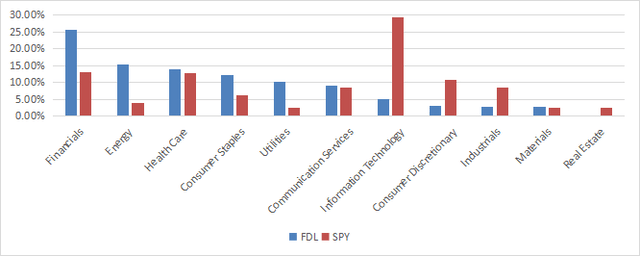
The portfolio is concentrated and exposure to risks related to the heaviest constituents is significant. Indeed, the top 10 holdings, listed in the next table, have an aggregate weight of 55%, and the top 6 are between 5% and 9%.
|
Ticker |
Name |
Weight |
EPS growth % TTM |
P/E TTM |
P/E fwd |
Yield % |
|
VZ |
Verizon Communications Inc. |
9.03% |
7.88 |
7.45 |
7.85 |
7.19 |
|
ABBV |
AbbVie Inc. |
8.41% |
-51.30 |
42.23 |
13.75 |
4.02 |
|
CVX |
Chevron Corporation |
7.09% |
-23.48 |
10.75 |
10.80 |
4.18 |
|
PM |
Philip Morris International Inc. |
6.05% |
-8.34 |
18.35 |
15.45 |
5.51 |
|
PFE |
Pfizer Inc. |
5.46% |
-64.94 |
14.64 |
15.31 |
6.15 |
|
IBM |
International Business Machines Corporation |
5.06% |
449.42 |
21.71 |
17.18 |
4.06 |
|
MO |
Altria Group, Inc. |
4.92% |
90.49 |
8.57 |
8.47 |
9.33 |
|
C |
Citigroup Inc. |
3.74% |
-13.67 |
7.83 |
8.40 |
4.30 |
|
DUK |
Duke Energy Corporation |
2.69% |
-68.34 |
62.32 |
17.52 |
4.18 |
|
SO |
The Southern Company |
2.56% |
-12.45 |
26.46 |
20.29 |
3.83 |
Ratios from Portfolio123.
Fundamentals
FDL is much cheaper than the S&P 500 regarding valuation ratios, as reported in the next table. Nevertheless, valuation metrics must be considered with caution: they are skewed by financials, where these ratios are lower, and unfortunately much less reliable than in other sectors.
|
FDL |
SPY |
|
|
Price/Earnings TTM |
11.56 |
22.64 |
|
Price/Book |
1.57 |
4 |
|
Price/Sales |
1.33 |
2.58 |
|
Price/Cash Flow |
7.58 |
15.71 |
In my ETF reviews, risky holdings are companies with at least two red flags among: bad Piotroski score, negative ROA, unsustainable payout ratio, and bad or dubious Altman Z-score, excluding financials for which these metrics are unreliable. FDL holds 101 stocks, of which 17 are risky regarding these assumptions. They weigh 10% of asset value, which looks acceptable. Nevertheless, this rate ignores the heaviest sector, financials.
My calculations of aggregate quality metrics, reported in the next table, point to a portfolio quality significantly inferior to the benchmark.
|
FDL |
SPY |
|
|
Atman Z-score |
1.82 |
3.58 |
|
Piotroski F-score |
5.27 |
5.69 |
|
ROA % TTM |
4.32 |
7.23 |
Performance
FDL has underperformed SPY by 2.3% in annualized return since 4/1/2006. Moreover, risk measured in drawdown and standard deviation of monthly returns (volatility) is significantly higher.
|
Total Return |
Annual Return |
Drawdown |
Sharpe ratio |
Volatility |
|
|
FDL |
249.59% |
7.33% |
-65.93% |
0.42 |
16.61% |
|
SPY |
408.62% |
9.63% |
-55.19% |
0.57 |
15.69% |
Data calculated with Portfolio123.
The annual sum of distributions has increased from $0.71 per share in 2012 to $1.31 in 2022. It represents an 84.5% growth in 10 years, beating by far the cumulative inflation: about 29%, based on CPI.
FDL distribution history since 2012 (Seeking Alpha)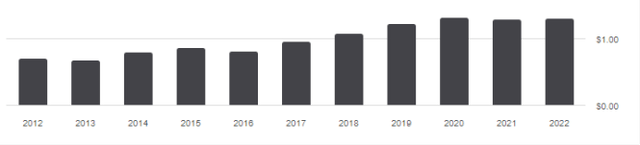
In previous articles, I have shown how three factors may help cut the risk in a dividend portfolio: Return on Assets, Piotroski F-score, and Altman Z-score.
The next table compares FDL since 4/1/2006 with a subset of the S&P 500: stocks with an above-average dividend yield, an above-average ROA, a good Altman Z-score, a good Piotroski F-score, and a sustainable payout ratio. The subset is rebalanced annually to make it comparable to a passive index.
|
Total Return |
Annual Return |
Drawdown |
Sharpe ratio |
Volatility |
|
|
FDL |
249.59% |
7.33% |
-65.93% |
0.42 |
16.61% |
|
Dividend quality subset |
502.27% |
10.68% |
-43.41% |
0.64 |
15.41% |
Past performance is not a guarantee of future returns. Data Source: Portfolio123.
FDL lags the dividend quality subset by 3.35% in annualized return and shows a much deeper maximum drawdown. A note of caution: ETF performance is real and this subset is simulated. My core portfolio holds 14 stocks selected in this subset (more info at the end of this post).
FDL vs. competitors
The next tables compare the characteristics of FDL and three other U.S. large cap dividend funds:
- SPDR S&P Dividend ETF (SDY).
- Schwab U.S. Dividend Equity ETF (SCHD).
- iShares Select Dividend ETF (DVY).
- First Trust Value Line Dividend Index Fund ETF (FVD).
|
FDL |
SDY |
SCHD |
DVY |
FVD |
|
|
Inception |
3/9/2006 |
11/8/2005 |
10/20/2011 |
11/3/2003 |
8/19/2003 |
|
Expense Ratio |
0.45% |
0.35% |
0.06% |
0.38% |
0.65% |
|
AUM |
$3.99B |
$20.90B |
$50.84B |
$19.13B |
$10.89B |
|
Avg Daily Volume |
$29.39M |
$65.14M |
$276.72M |
$91.23M |
$48.76M |
|
Holdings |
101 |
124 |
104 |
105 |
162 |
|
Top 10 |
55.90% |
21.20% |
40.86% |
18.74% |
6.62% |
|
Turnover |
60.00% |
29.00% |
28.00% |
15.00% |
53.00% |
|
4 Yr Average Yield |
4.09% |
2.73% |
3.26% |
3.57% |
2.15% |
|
Div. Growth 5 Yr (annualized) |
8.27% |
5.96% |
13.05% |
5.95% |
5.93% |
FDL has the highest 4-year average yield. On the downside, it is the most concentrated of these funds and has the highest turnover rate. It is inferior to SCHD regarding the 5-year dividend growth rate and has a materially higher expense ratio.
It is behind SCHD in 10-year total return, and has also lagged it in 2023 to date, as reported on the charts below. The difference with other competitors is not significant.
FDL vs competitors, 10-year total return (Seeking Alpha)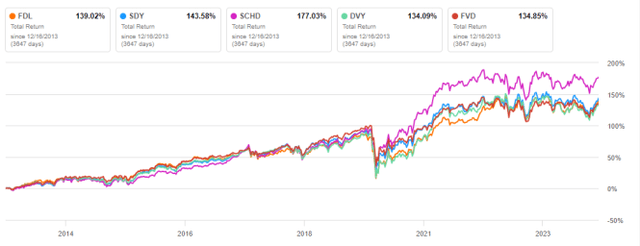
FDL vs competitors, 2023 to date (Seeking Alpha)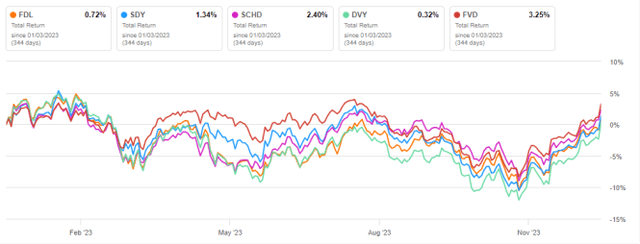
Takeaway
First Trust Morningstar Dividend Leaders Index Fund ETF holds 100 stocks showing 5-year dividend growth and a sustainable payout ratio. The portfolio is quite concentrated in financials and in top holdings. Valuation ratios look cheap, but they are biased by the weight of financials. Quality metrics are below par.
The fund has underperformed the S&P 500 since inception and shows a higher risk in drawdown and volatility. Schwab U.S. Dividend Equity ETF looks more attractive regarding a return, dividend growth, fees, and liquidity. It is also better balanced across sectors and has a much lower weight allocated to financials (15.1%).
Read the full article here