The Weekly Closed-End Fund Roundup will be put out at the start of each week to summarize recent price movements in closed-end fund [CEF] sectors in the last week, as well as to highlight recently concluded or upcoming corporate actions on CEFs, such as tender offers. Data is taken from the close of March 29th, 2024.
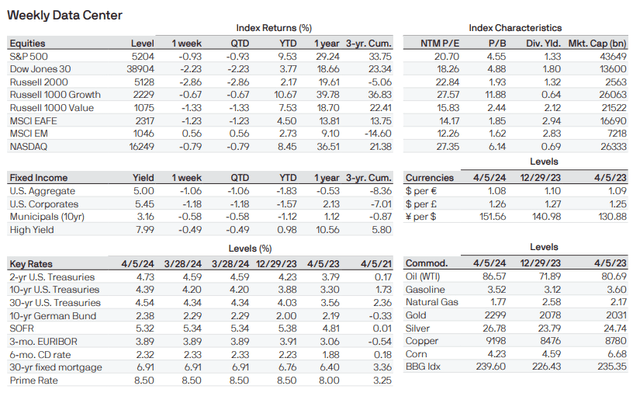
JPMorgan releases a nice Weekly Market Recap every week. These are the key index levels this week:
JPMorgan
Weekly performance roundup
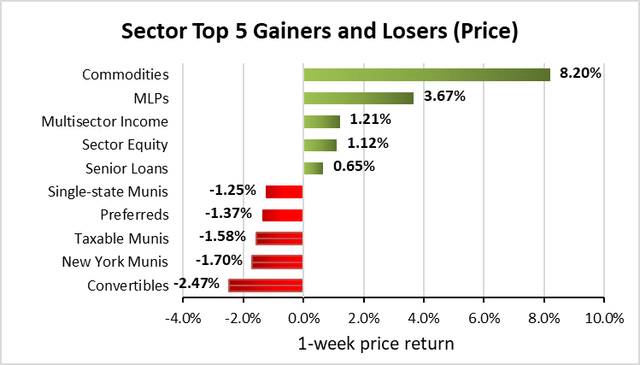
For CEFs, 9 out of 22 sectors were positive on price and the average price return was +0.15%. The lead gainer was Commodities (+8.20%) while Convertibles lagged (-0.47%).
Income Lab
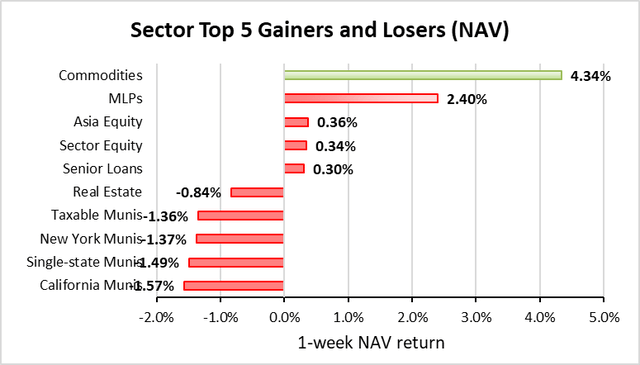
8 out of 22 sectors were positive on NAV, while the average NAV return was -0.04%. The top sector by NAV was Commodities (+4.34%) while the weakest sector by NAV was California Munis (-0.72%).
Income Lab
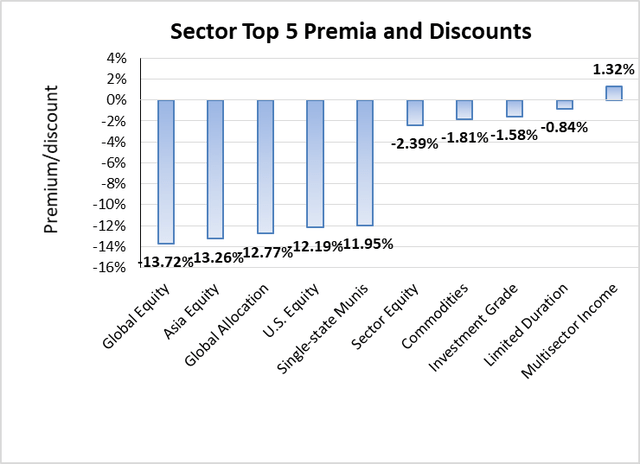
The sector with the highest premium was Multisector Income (+1.32%), while the sector with the widest discount is Global Equity (-13.72%). The average sector discount is -7.18%.
Income Lab
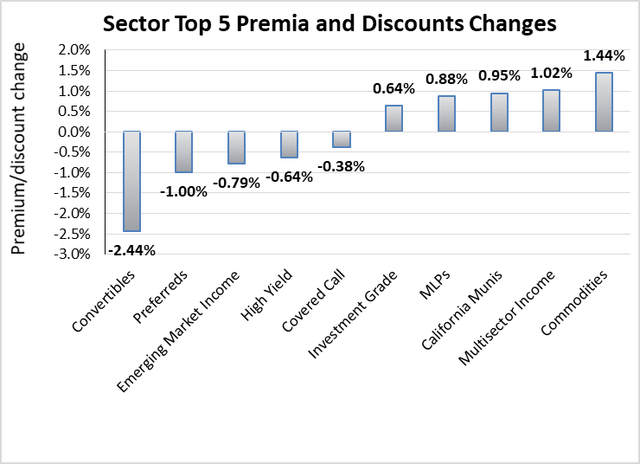
The sector with the highest premium/discount increase was Commodities (+1.44%), while Convertibles (-2.44%) showed the lowest premium/discount decline.
Income Lab
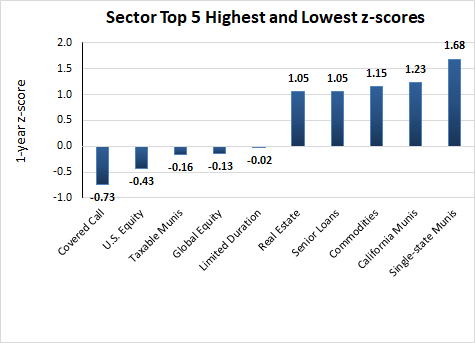
The sector with the highest average 1-year z-score is Single-state Munis (+1.68), while the sector with the lowest average 1-year z-score is Covered Call (-0.73). The average z-score is +0.50.
Income Lab
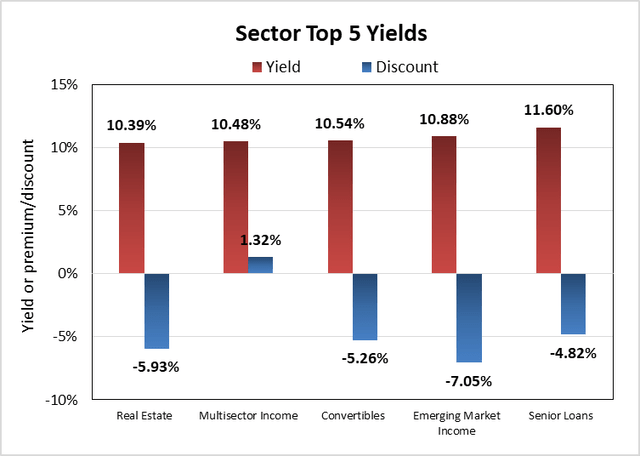
The sectors with the highest yields are Senior Loans (+11.60%), Emerging Market Income (+10.88%), and Convertibles (+10.54%). Discounts are included for comparison.
Income Lab
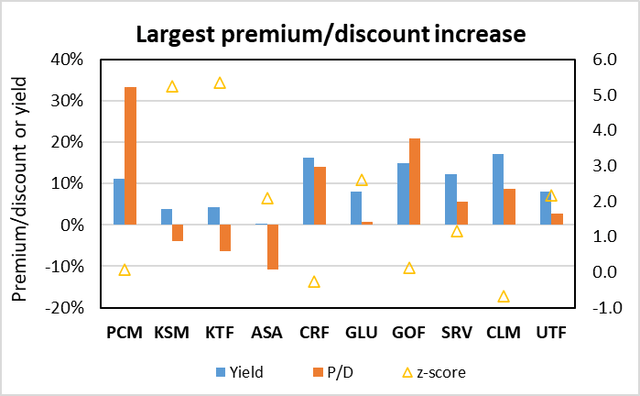
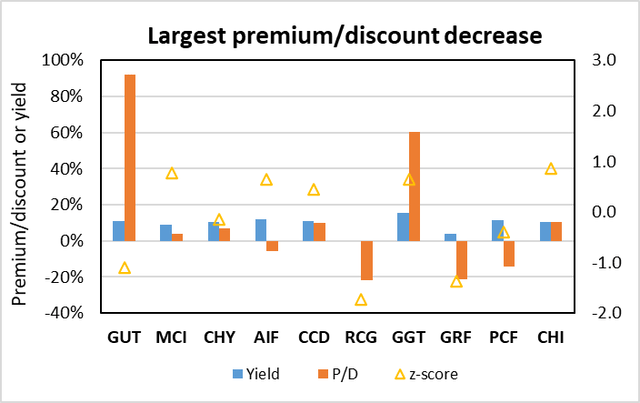
Individual CEFs that have undergone a significant decrease in premium/discount value over the past week, coupled optionally with an increasing NAV trend, a negative z-score, and/or are trading at a discount, are potential buy candidates.
| Fund | Ticker | P/D increase | Yield | P/D | z-score | Price change | NAV change |
| PCM Fund | (PCM) | 7.55% | 11.09% | 33.23% | 7.00% | 5.35% | -0.61% |
| DWS Strategic Muni Income | (KSM) | 7.16% | 3.77% | -3.93% | 524.00% | 6.12% | -1.78% |
| DWS Municipal Income | (KTF) | 6.92% | 4.39% | -6.37% | 536.00% | 6.10% | -1.73% |
| ASA Gold and Precious Metals Limited | (ASA) | 5.76% | 0.24% | -10.89% | 208.00% | 12.74% | 0.82% |
| Cornerstone Total Return Fund | (CRF) | 5.70% | 16.20% | 14.12% | -25.00% | 4.77% | -0.44% |
| Gabelli Global Utility & Income | (GLU) | 5.27% | 8.05% | 0.81% | 261.00% | 6.81% | 1.23% |
| Guggenheim Strategic Opp Fund | (GOF) | 5.03% | 14.89% | 20.92% | 13.00% | 4.34% | 0.00% |
| NXG Cushing Midstream Energy Fund | (SRV) | 4.83% | 12.21% | 5.64% | 115.00% | 9.75% | 4.78% |
| Cornerstone Strategic Value | (CLM) | 4.44% | 17.04% | 8.82% | -67.00% | 3.80% | -0.42% |
| Cohen & Steers Infrastructure | (UTF) | 4.22% | 7.98% | 2.78% | 216.00% | 4.86% | 0.58% |
Income Lab
Conversely, individual CEFs that have undergone a significant increase in premium/discount value in the past week, coupled optionally with a decreasing NAV trend, a positive z-score, and/or are trading at a premium, are potential sell candidates.
| Fund | Ticker | P/D decrease | Yield | P/D | z-score | Price change | NAV change |
| Gabelli Utility Trust | (GUT) | -6.63% | 10.97% | 91.93% | -110.00% | -1.62% | 1.79% |
| Barings Corporate Investors | (MCI) | -6.36% | 8.89% | 3.82% | 77.00% | -5.48% | 0.00% |
| Calamos Convertible & High Income Fund | (CHY) | -5.90% | 10.51% | 7.03% | -15.00% | -5.50% | -0.28% |
| Apollo Tactical Income Fund Inc. | (AIF) | -5.76% | 11.82% | -5.93% | 64.00% | 0.14% | 0.39% |
| Calamos Dynamic Convertible and Income | (CCD) | -5.18% | 11.05% | 9.92% | 45.00% | -4.81% | -0.31% |
| RENN Fund ord | (RCG) | -4.90% | % | -21.74% | -173.00% | 1.24% | 4.59% |
| Gabelli Multimedia | (GGT) | -3.95% | 15.57% | 60.51% | 65.00% | -1.57% | 0.86% |
| Eagle Capital Growth | (GRF) | -3.90% | 3.73% | -21.12% | -137.00% | -0.64% | 2.97% |
| High Income Securities | (PCF) | -3.59% | 11.50% | -14.04% | -39.00% | -2.99% | 1.07% |
| Calamos Convertible Opp Inc | (CHI) | -3.37% | 10.22% | 10.60% | 87.00% | -3.25% | -0.30% |
Income Lab
New!
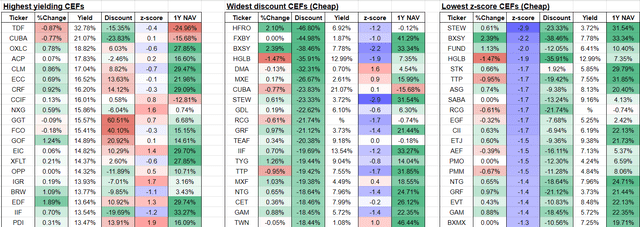
From our screener, here are the CEFs with the highest yields, widest discounts, and lowest 1-year z-scores:
Income Lab
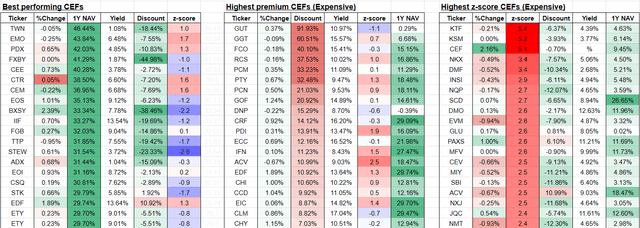
From our screener, here are the CEFs with the best 1-year performance, highest premiums, and highest 1-year z-scores:
Income Lab
Recent corporate actions
These are from the past month. Any new news in the past week has a bolded date:
March 20, 2024 | The Herzfeld Caribbean Basin Fund, Inc. ANNOUNCES PRELIMINARY TENDER OFFER RESULTS.
Upcoming corporate actions
These are from the past month. Any new news in the past week has a bolded date:
March 28, 2024 | DWS Municipal Income Trust Announces Termination and Liquidating Distribution to Shareholders and Distribution Rate Increase.
March 28, 2024 | DWS Strategic Municipal Income Trust Announces Termination and Liquidating Distribution to Shareholders.
March 1, 2024 | First Trust Announces Shareholder Approvals of the Mergers.
Recent activist or other CEF news
These are from the past month. Any new news in the past week has a bolded date:
April 4, 2024 | Voya announces change to distribution frequency from quarterly to monthly on four funds.
April 4, 2024 | MidCap Financial Investment Corporation, Apollo Senior Floating Rate Fund Inc. and Apollo Tactical Income Fund Inc. Announce Filing of Definitive Joint Proxy Statement / Prospectus Relating to Previously Announced Proposed Mergers.
March 1, 2024 | Pimco Dynamic Income Strategy Fund Declares Common Share Distributions.
Commentary
1. Voya option income funds go monthly (portfolio holding)
Voya has moved four option income funds from a quarterly distribution schedule to a monthly distribution:
- Voya Global Advantage and Premium Opportunity Fund (IGA),
- Voya Infrastructure, Industrials and Materials Fund (IDE),
- Voya Asia Pacific High Dividend Equity Income Fund (IAE),
- Voya Emerging Markets High Dividend Equity Fund (IHD).
Our Income Generator portfolio currently holds IGA at a 7.5% allocation. IGA currently trades at a -12.59% discount with a 9.01% distribution yield, and is rated as a BUY with a “buy under discount” of -10%.
I view this change as a positive because investors tend to prefer the regularity of monthly distributions over quarterly, and the costs for implementing this change should be minimal.
I believe this change is likely an effort by management to tackle the persistent discount of these CEFs in response to Saba accumulating a stake in these funds. Saba’s 13D for IGA, indicating active intent, was filed last year on November 1, 2023, and they currently own 6.78% of the fund.
Editor’s Note: This article covers one or more microcap stocks. Please be aware of the risks associated with these stocks.
Read the full article here
