Thesis
The goal of this article is to form a return projection for the overall equity market represented by the Vanguard S&P 500 ETF (NYSEARCA:VOO). The projection will be made mainly based on the ECY (excess CAPE yield). The choice of VOO is motivated by two considerations. First, thanks to the fund’s low fee, the fund tracks the underlying S&P 500 index closely (more on this in the second section). And second, most investors express their views on the overall market via an index fund rather than the index itself. Thus, as a popular fund, analysis based on VOO can be more tangible and actionable for many investors.
Let me first give away my end result, which is quite gloomy. I’m projecting VOO’s price to be around $428 by the end of 2024. Compared to its current price of $463, this represents a downside risk of around 8%. My projection for longer-term return is no more than 5% per annum in the next few years – quite uninspiring as well.
In the remainder of this article, I will detail the above projections and also suggest a few alternative ideas along the way.
VOO and S&P 500
First, let me quickly justify why the fund is a good proxy for the S&P 500 index itself. First, the fund is indexed based on the S&P 500 (see the fund descriptions below).
VOO invests in stocks in the S&P 500 Index, representing 500 of the largest U.S. companies. Its goal is to closely track the index’s return, which is considered a gauge of overall U.S. stock returns.
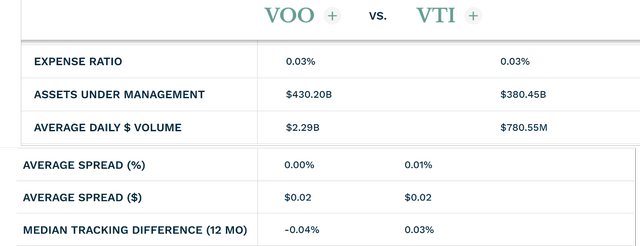
However, in practice, tracking errors occur for a variety of reasons, such as expense ratios, trading spreads, and tracking differences. For VOO, the impact of these factors is as minimal as one can get – in the universe of ETFs anyway. There are now mutual funds with zero fees (check out the Fidelity funds in case you are interested). The table below summarizes these factors for VOO in comparison with another large overall market fund VTI (a fund we actually hold and will revisit later) to better contextualize things. As seen, VOO boasts a huge AUM (more than $430 billion), charges a very low fee of 0.03%, and enjoys excellent liquidity. Its daily volume is around $2.3 billion, many times higher than VTI. Thanks to these factors, VOO essentially trades with no spread as seen.

Source: ETF.com
The big picture
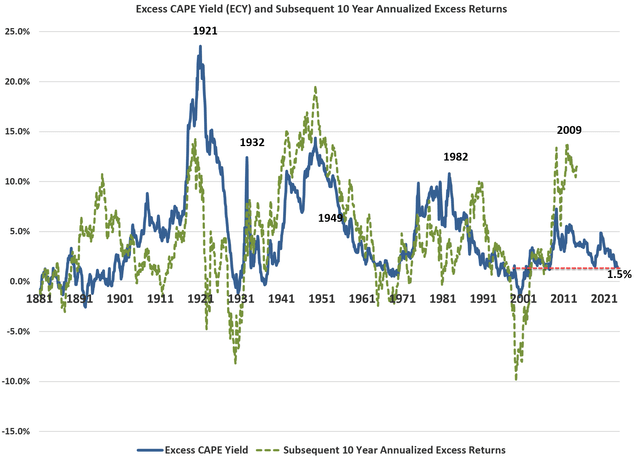
Before I get into the projection for 2024, let me start with a big picture first, as shown below. The chart shows the Excess CAPE Yield (“ECY”) of the S&P 500 index (the blue line) plotted against the subsequent 10-year annualized excess returns of the index (the green line) from 1881 to 2021. The data is taken from Dr. Robert Shiller’s book Irrational Exuberance. You can visually see the clear correlation between the two lines over the long term. The reason behind this is very simple. A low ECY indicates that the S&P 500 is trading at a high valuation relative to risk-free rates (i.e., the real 10-year treasury rates). Thus, I would expect a lower odd for the S&P 500 to outperform treasury rates and vice versa.
The ECY currently hovers around 1.5% as seen, among the lowest level historically. The last occurrences of such low ECY date back to the conditions before the dot.com bubble and 2008 crises. In both cases, the return in the next 10 years was below 5% per annum, and I don’t expect this time to be different.
Also note that the chart below shows data as of April 1, 2024. The 10-year rates have pushed up quite a bit since then, further narrowing the ECY, as detailed next.

ECY
VOO 2024 return projection
Now, let me switch gears to the near term. My projections are summarized in the table below. As aforementioned, I’m forecasting VOO to end 2024 with a price of around $428, about 8% below its current price.

Author
And let me walk over the rationale behind the table. According to LSEG data, analysts expect overall S&P 500 earnings to rise 9.5% in 2024 compared to 2023. Thus, my projection assumed a $210 per share of earnings for the S&P 500 in 2024. With this input, the cyclical adjusted EPS (CA EPS) turned out to be $159 per share. Thus the FWD CAPE ratio is around 31.76x based on the price data as of this writing. With a 10-year real rate of 2.24%, this means an ECY of only 0.91%, even thinner than the 1.5% quoted above in early April.
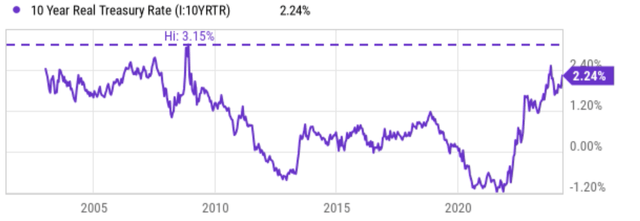
Looking ahead, with persistent inflation (especially after the March CPI data), the odds of an interest cut have become much lower than previously expected. I see good odds for real interest rates to climb further up. As seen in the chart below, real interest rates have certainly been higher in recent history. It peaked at around 2.5% in 2023 and peaked at around 3.15% in the past ~20 years. Based on the assumption of real rates of 2.5% and the ECY remaining at the current level of 0.91% (which is a very aggressive assumption in my view), the CAPE ratio would be around 29.3x. Putting together this CAPE ratio and CA EPS forecast made earlier, my forecast for the S&P 500 is around 4,666, translating into a VOO price of around $428.

Seeking Alpha
Other risks and final thoughts
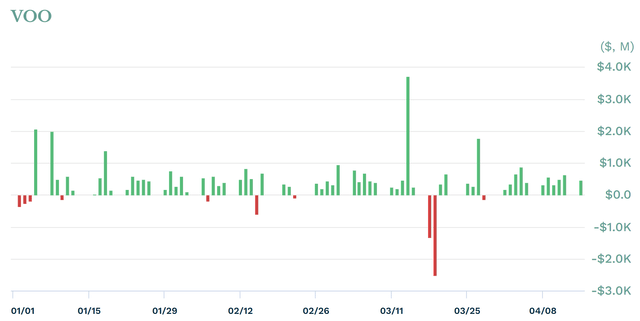
Risks associated with VOO are essentially the same macroeconomic risks facing the overall economy (geopolitical risks, recession, etc.). In terms of upside risks, the key risk to my thesis is momentum trading. The chart below describes the fund flows for the VOO fund on a daily basis this year. As seen, VOO has been enjoying a strong inflow of funds. This year so far, VOO only suffered 10 days of fund outflow. Cumulative, VOO has attracted a net inflow of more than $29B year-to-date according to ETF.com data. In the short term, such strong momentum can keep driving VOO prices higher, despite valuation risks and the actual performance of the underlying holdings.
All told, I see quite an uninspiring return profile for VOO ahead. My key concerns are high valuation risks, especially benchmarked against risk-free rates. Such valuation indicates either high growth expectations and/or a decline in risk-free rates. For growth expectations, I think the market expectation of a 9.5% YOY growth already is on the aggressive side. For rate decline, I see a very low chance for this to happen in 2024 given the current CPI data. However, in the longer term, it’s never a good idea to be completely out of the market (let alone betting against it). And VOO is one of the best ETF funds in our mind to gain exposure to the overall market.
Finally, let me close by offering an alternative idea – VTI. Under current conditions, we prefer (and actually hold) VTI over VOO. Our thought process is detailed in this recent article. The gist is that as a total market fund, VTI provides exposure to mid- and small-cap stocks, which offer higher growth potential at a much more reasonable valuation (maybe even slightly discounted) compared to large caps.

Source: ETF.com
Read the full article here
