After reaching prior highs just above $220 during the first half of April 2020, the SPDR Gold Shares Trust (NYSEARCA:GLD) has had an extremely difficult time maintaining those lofty valuations – and the resulting short-term volatility that has been seen after this bearish rejection has many investors wondering if the massive bull run that we have seen in funds tied to the underlying value of precious metals has finally come to an end.
GLD Overbought Technical Indicator (Income Generator via TradingView)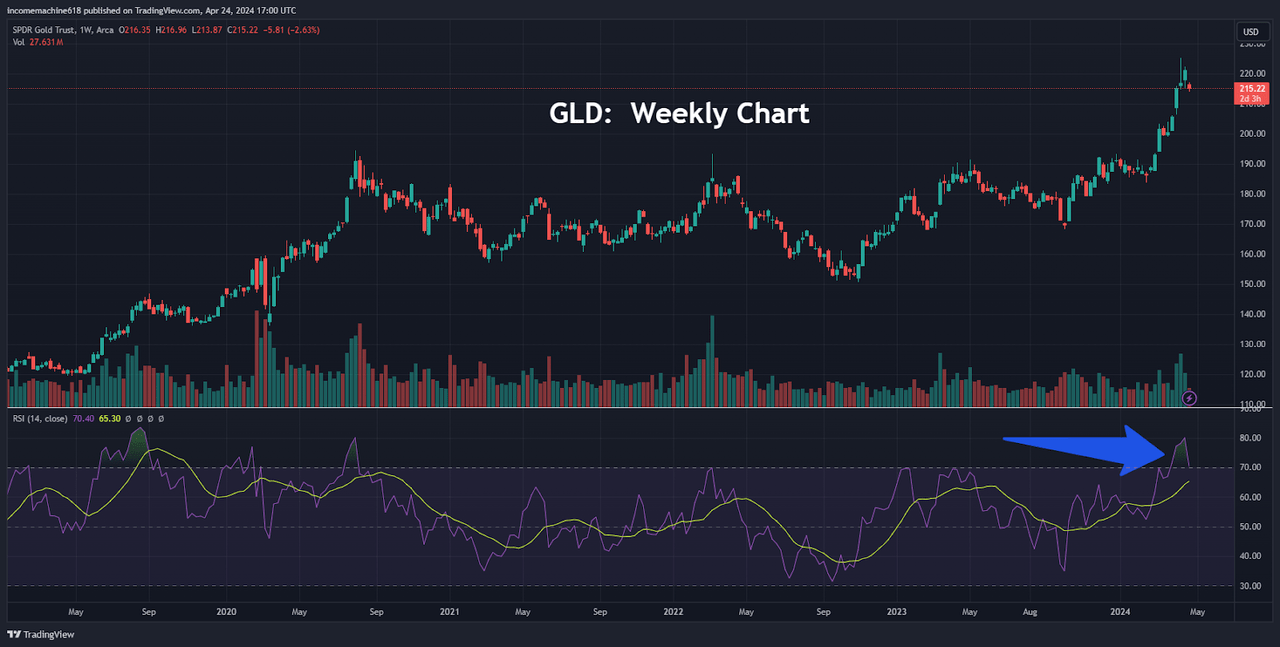
When looking at the SPDR Gold Trust ETF’s recent price history, one clear attribute that can be cited as a cause for concern can be found in the Relative Strength Index (RSI), which is a closely watched momentum indicator that was designed to signal overbought and oversold conditions in market assets. Specifically, GLD’s recent breakout activity sent fund valuations into highly overbought territory – at levels which had not been seen since early August 2020 (in a prior market move that precipitated lengthy declines toward the lows just above $150 in October 2022).
But while these types of technical indicators do have their merits, many of these signals can be distorted by the broader trend activity that characterizes the price action that can be seen during specific periods of time.
In this case, GLD was essentially caught in a long-term sideways trend that was defined by a broader range of less than $40. In other words, what might have appeared to be volatile activity based on indicator readings actually resulted in relatively minor price moves in terms of actual market price differences.
Long-term GLD Trend Activity (Income Generator via TradingView)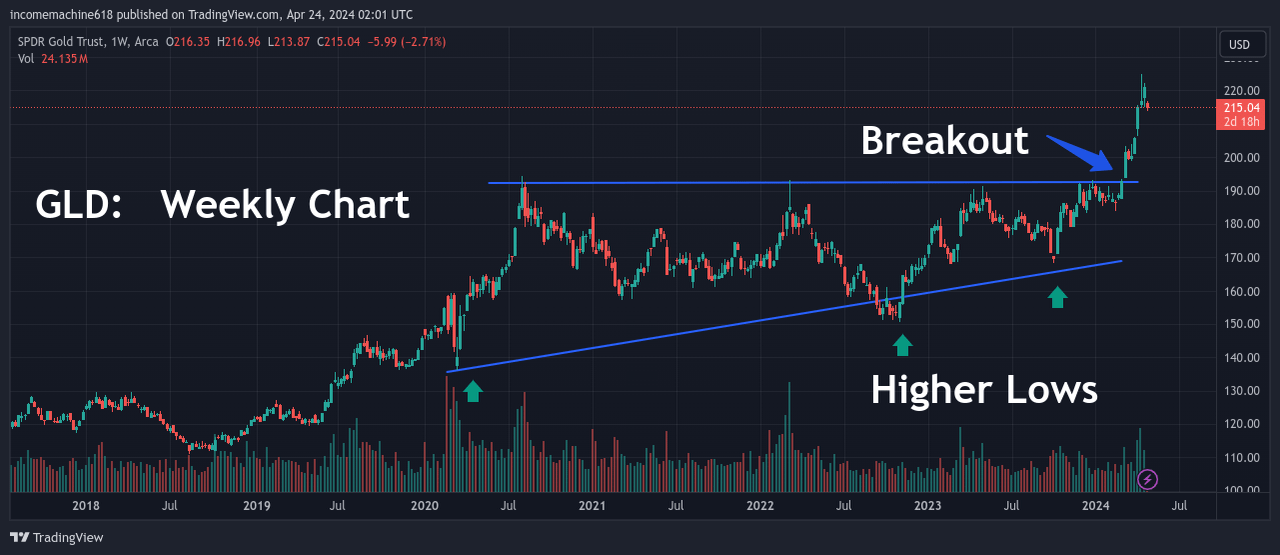
More recently, however, price activity in GLD has been much more decisive. In summary, a series of higher price lows (starting in March 2020) ultimately led to a sharp breakout that became quite apparent in February of this year.
Essentially, this decisive trend activity can be analyzed from a long-term perspective and these moves strongly correlate with the rising framework in U.S. consumer inflation data that has characterized the country’s economy during the same period of time.
Long-term CPI Trends Continue (Trading Economics / U.S. Bureau of Labor Statistics)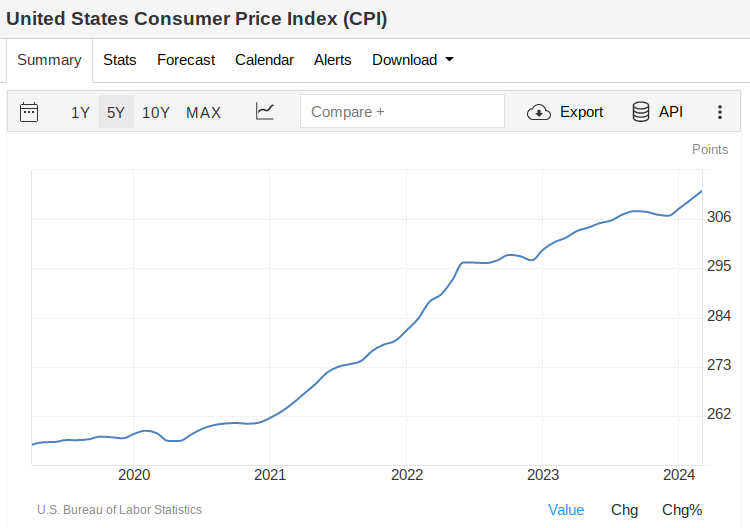
Unfortunately, these problematic trends in consumer inflation have been quite apparent no matter which data report is used as the basis for the analysis. Consumer Price Index (CPI) readings tend to get the most attention in the U.S. news media but trends in Personal Consumption Expenditures (PCE) are often cited as the Federal Reserve’s preferred method for analyzing these economic trends and might provide a better indicator of changes we are likely to see in U.S. interest rate levels before the end of this year.
Long-term PCE Trends Continue (Trading Economics / U.S. Bureau of Economic Analysis)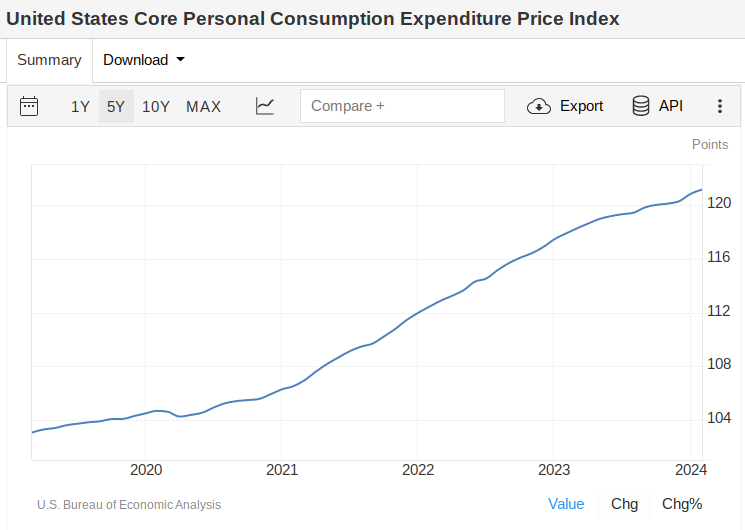
In any case, it is very difficult to deny the clear confluences that we have seen with the strong upward spike in U.S. inflation data and the beginning of the long-term upward trajectory that we have seen in the SPDR Gold Trust over the same period of time.
Given the sustained strength of these correlations, it makes little sense to trade GLD from the bearish perspective while relying on short-term overbought readings that can be found in price chart indicators (such as RSI) as long as these problematic economic trends show no substantive signs of a sustainable reversal.
Short-term GLD Flows Turn Negative (ETFdb)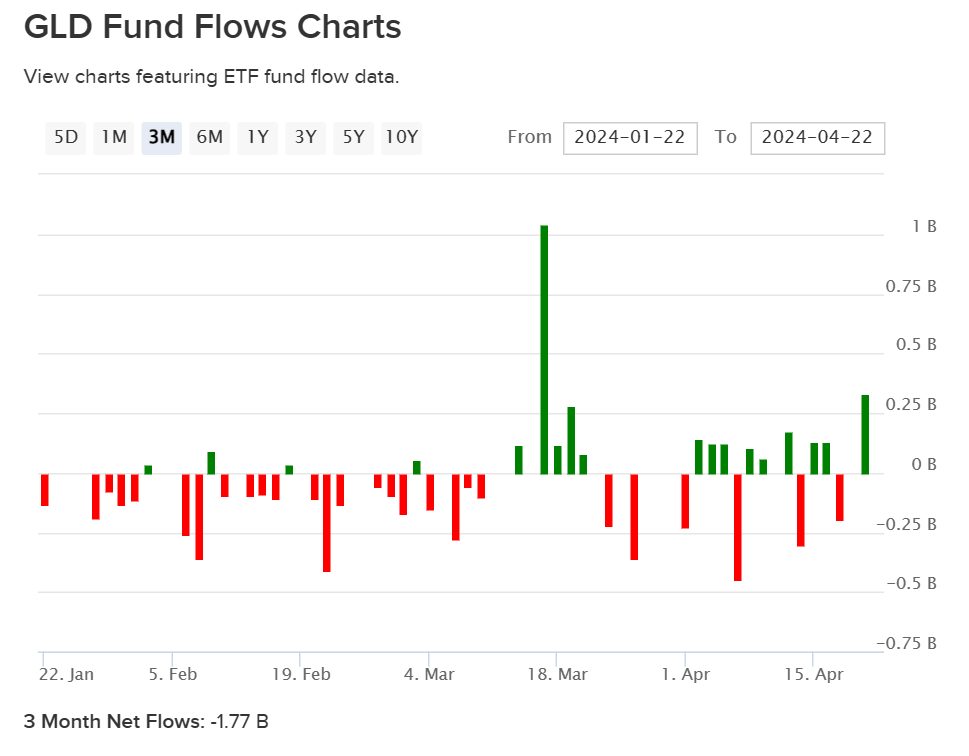
All of that said, it is always important to maintain a balanced view and look for potential reasons which might dismantle the bullish arguments for GLD. One area that signals some cause for concern can be found in the fund flows themselves. Specifically, fund flows in the SPDR Gold Trust ETF have officially flipped into negative territory if we are looking at investor activity over the most recent three-month period.
Over this timeframe, GLD investor outflows can now be seen at -1.77 billion and this does lend some credence to the argument that the market might be ready to collect some profits after the massive bullish run that precious metals funds have experienced since the beginning of this year.
Long-term GLD Flows Remain Positive (ETFdb)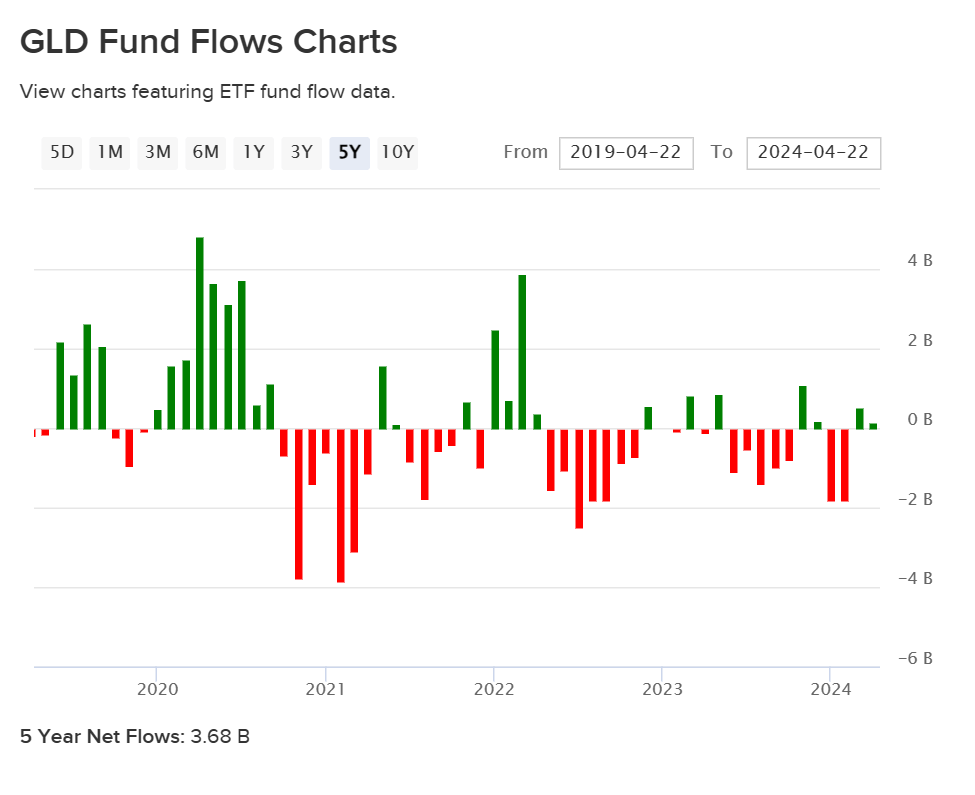
However, longer-term evidence calling for continued strength in the SPDR Gold Trust ETF can be found in the fund flows over the last five-year period. Over this timeframe, investor activity remains firmly in bullish territory, with the SPDR Gold Trust attracting positive inflows of 3.68 billion.
On balance, all of this activity remains favorable as this suggests that the market is not heavily long GLD even while the fund is still trading at elevated price levels. In other words, recent outflow activity suggests that more new buyers are still available to enter the market and drive moves higher into the end of 2024.
China Purchases Remain Robust (China Customs / Bloomberg)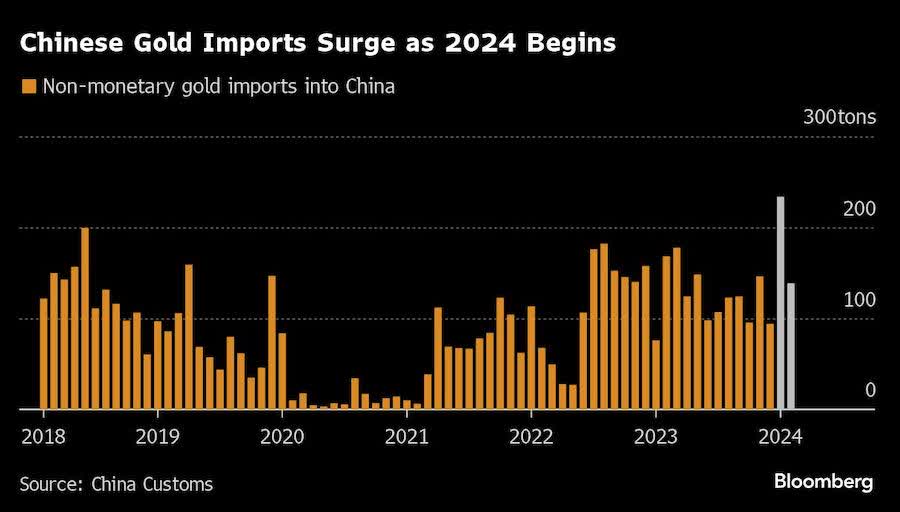
With strong central bank buying activity seen in diverse locations around the world, we can clearly see that broad interest in this asset class remains robust and many on Wall Street also appear to be onboard with this bullish outlook. Of course, most of this buying activity has occurred in China and this has helped generate speculation that further market rallies could be vulnerable if the Middle Kingdom decides to focus its attention on other areas of the market.
But a large portion of Wall Street’s analyst community still seems to be onboard with the positive outlook, with some analysts actually suggesting that the recent April declines can be viewed as a healthy correction in an otherwise stable uptrend. All of this considered, we are siding with the bullish side of the argument and maintaining our long position in GLD as a protective measure of safety in an otherwise volatile market.
With military activity continuing in both Ukraine and the Middle East, it seems unlikely that the market will be looking to adopt a risk-off mentality any time soon. Since GLD tends to be one of the market’s most popular beneficiaries during instances of broader geopolitical instability and long-term U.S. inflation levels show very little sign of producing a sustainable reversal prior to the 2024 U.S. Presidential election, we think it makes much more sense to overlook short-term fluctuations in technical price indicators and instead focus on the more influential aspects of asset valuation that are likely to influence these trends over time.
Read the full article here
