
August hit the market like a ton of bricks. The month used to be the best for markets, as the table below shows, but over the last 40 years or so it has flipped to the worst month. In this article, we take a quick look at the situation in the income space in light of the price moves so far.
Marketwatch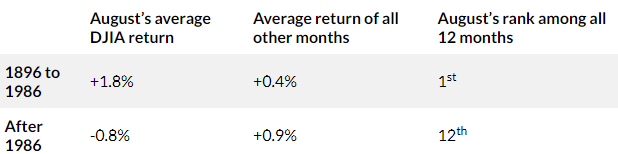
A Growth Drawdown
In a late July article, we discussed the historical patterns of income market drawdowns, the two types of drawdowns and how the next one was more likely to be a growth-type drawdown. Though we did not expect a market drawdown only days after the article, so far, it is playing out pretty much along the lines we expected.
A typical growth drawdown is caused by concerns about economic activity. In this type of drawdown, equity prices tend to fall and credit spreads tend to widen, while longer-term interest rates tend to fall. This is precisely what we have seen so far in August.
Higher-quality, longer-duration sectors like Munis have outperformed (and rallied) while equity and credit-linked sectors have underperformed (and fallen). An important point that we have stressed a number of times is that while Municipal bonds are also “credit” assets, they tend to hold up well during growth shocks. This is because credit spreads widen proportionally so higher-quality assets like Municipal bonds see relatively little spread widening versus corporate credit assets like high-yield corporate bonds and bank loans. This, along with the typical drop in longer-term rates, is what allows them to outperform.
Systematic Income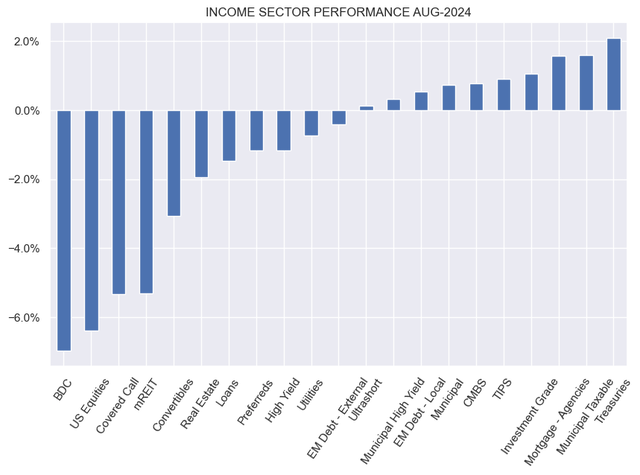
Key Patterns And Benchmarks
In addition to checking on the behavior of individual sectors, it’s important to look at the bigger picture of where valuations are today relative to their longer-term history. If we use high-yield corporate bonds as our credit market proxy, we get the following chart.
FRED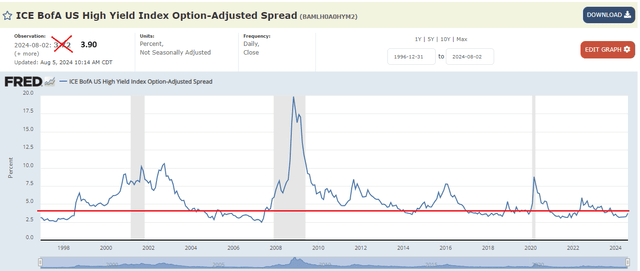
Typical recessions tend to see spreads top out somewhere around 7.5-10% – this includes 2001, the 2015 energy crash which technically was not a recession and the COVID recession. The data is always a day delayed, so we add Monday’s move to the chart, which takes us to around 3.90% in credit spreads. This is still low by historic standards, though not as screamingly low as it was just last week.
We would consider adding to higher-yielding assets once spreads move wider of 4-4.5% or so, adding risk in regular increments as spreads widen out to avoid blowing the entire dry-powder allocation at the start of what could be a protracted drawdown.
Interestingly, the equity market, as gauged by the VIX is more panicked than the credit market. The VIX is at the highest level since COVID, while credit spreads are still well below their 2022 levels.
Google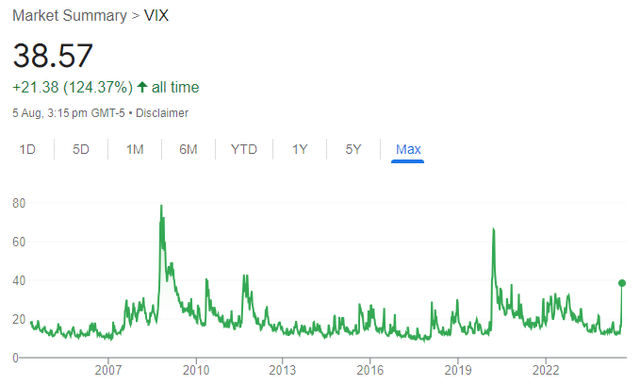
Let’s take a look at what CEFs have done. What we see is a similar sector response discussed above with equity and credit-linked sectors underperforming with higher-quality / longer-duration sectors like Munis, Agencies and Investment Grade corporate bonds outperforming.
Systematic Income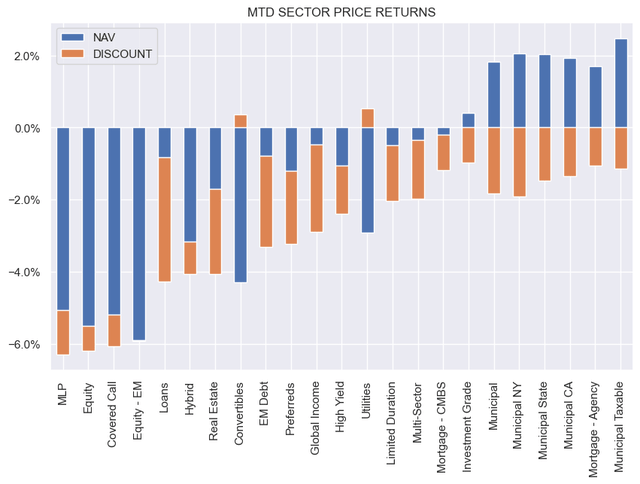
The second theme that has also delivered as expected is that CEFs underperformed ETFs. Some subscribers expressed confusion about why Muni CEFs did not rally in line with the drop in longer-term rates and their leveraged exposure. The reality is that discounts often matter more for CEF price behavior than NAVs. In fact, Muni discounts widened more than Equity, MLP and Covered Call sectors, all of which delivered big NAV drops vs. NAV rises for Muni CEFs.
Systematic Income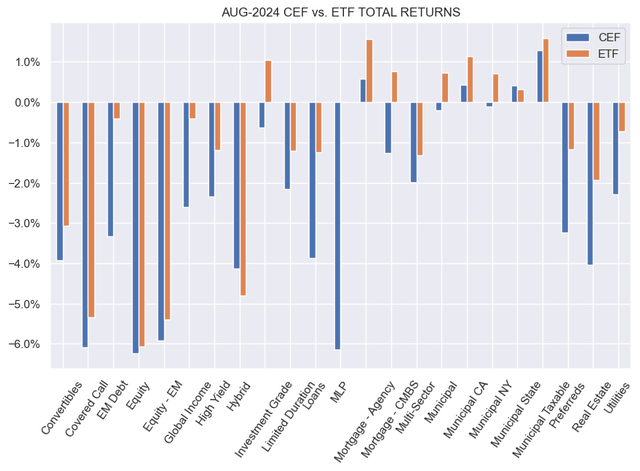
Another interesting theme that we have discussed a number of times is that Equity-linked CEF sector discounts often widen more than fixed-income discounts, despite their (Equity-linked CEFs) worse NAV behavior. This remains a puzzling but persistent theme in the CEF market. We saw much the same thing in 2020 as well.
Systematic Income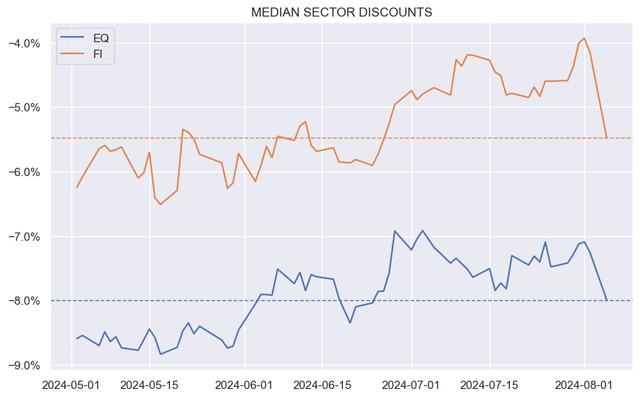
As far as CEF volume, it was elevated but on par with what we see every 6-12 months.
Systematic Income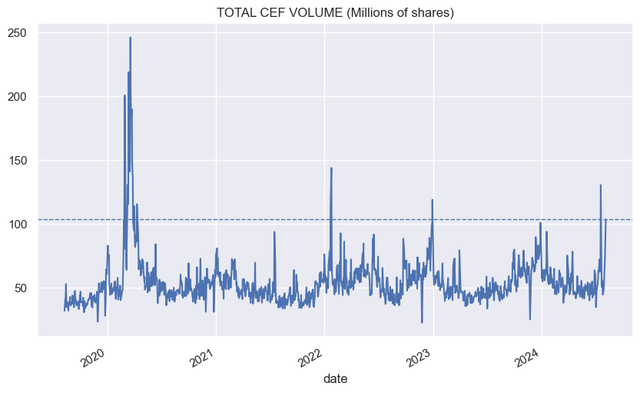
The level of the drawdown so far in August is very mild by historical standards, as the following chart shows.
Systematic Income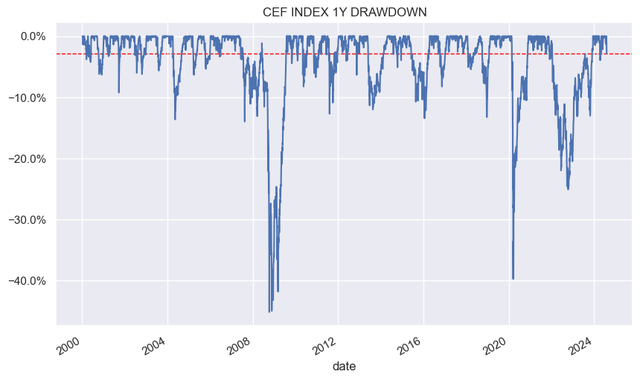
CEF discounts, in aggregate, are not particularly wide – they were significantly wider just earlier in the year.
Systematic Income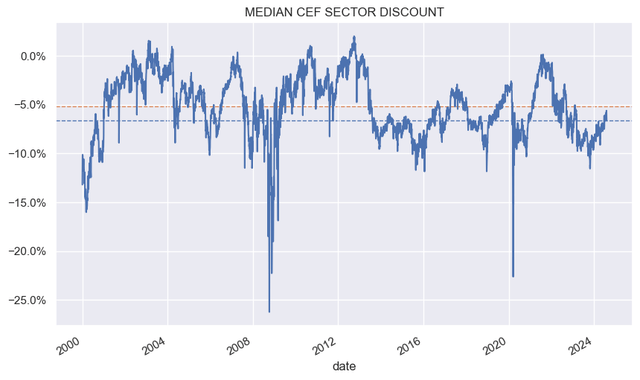
We have been making the point in our CEF Weeklies that the CEF market has been fairly expensive, with regard to both discounts, as well as, underlying asset valuations such as credit spreads. The move so far in August has not made it cheap, but it moved it in the right direction, as the following chart shows. The August combination of spreads and discounts moved towards the attractive green quadrant and away from the less attractive red quadrant.
Systematic Income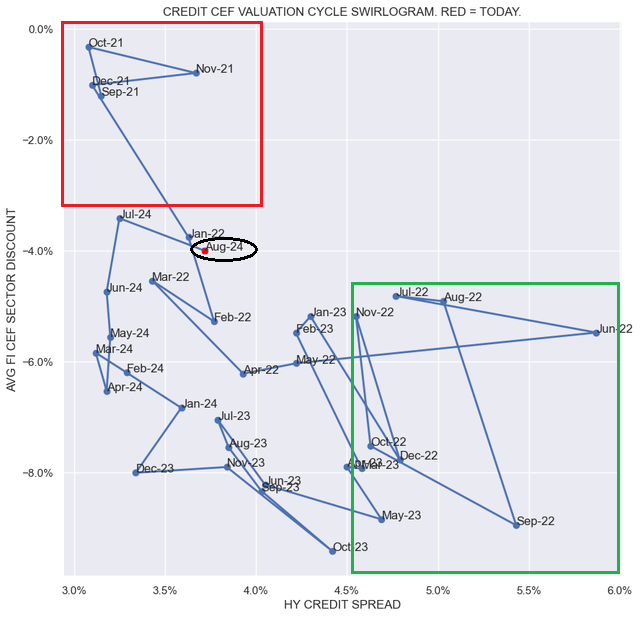
Within the CEF space, we continue to favor Municipal CEFs due to the combination of their relative resilience during growth drawdowns, still high real rates and wide discounts.
Systematic Income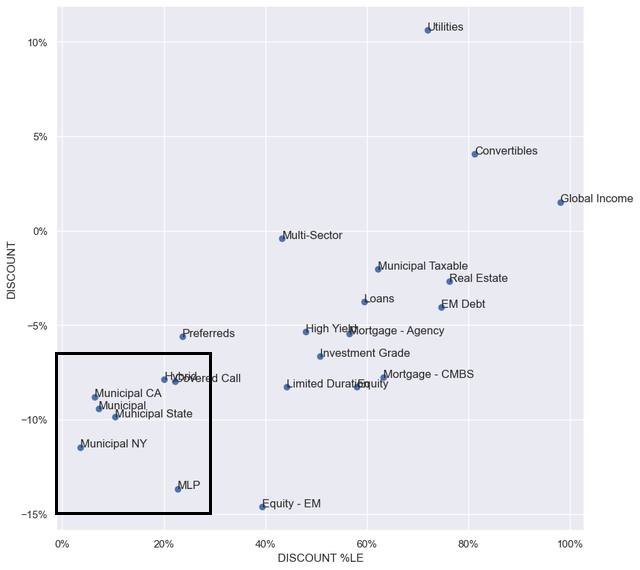
In this sector, we continue to like the conditional tender offer funds like EIM and MVF (see our previous commentary) that offer quite a lot of additional alpha above and beyond the sector exposure. They have discounts of around 10% and current yields of 5.8% and 4.9% respectively.
We also continue to like baby bonds, particularly from the BDC sector. Over the past week, they have been flat overall. Here, we like PFXNZ, CGBDL and TRINZ, trading with yields of 8.7%, 8.4% and 8.2% respectively.
We are also eyeing BDC common shares, where the average valuation has now fallen below the longer-term average. Here, OBDE and BBDC shares look attractive, trading at discounts of 12% and 19% and dividend yields of 11.2% and 11.9%.
Systematic Income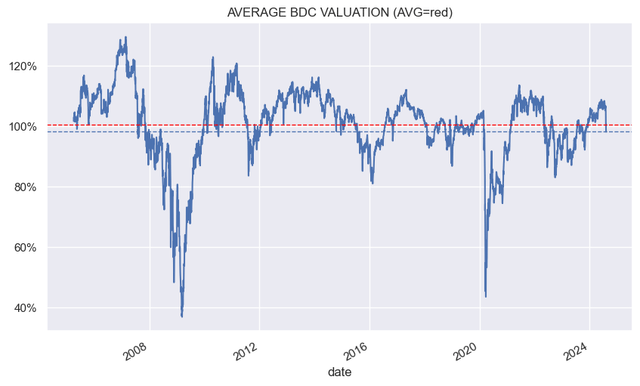
Read the full article here