Dear Baron Global Advantage Fund Shareholder:
Performance
Baron Global Advantage Fund® (the Fund) gained 9.4% in the first quarter of 2023, which compares to returns of 7.3% for the MSCI ACWI Index (the Index) and 13.8% for the MSCI ACWI Growth Index, the Fund’s benchmarks.
Table I. Performance[†]
|
Annualized for periods ended March 31, 2023 |
|||||
|
Baron Global Advantage |
Baron Global Advantage |
MSCI |
|||
|
Fund |
Fund |
MSCI |
ACWI |
||
|
Retail |
Institutional |
ACWI |
Growth |
||
|
Shares[1,2] |
Shares[1,2] |
Index[1] |
Index[1] |
||
|
Three Months[3] |
9.34% |
9.41% |
7.31% |
13.78% |
|
|
One Year |
-31.57% |
-31.39% |
-7.44% |
-10.02% |
|
|
Three Years |
1.02% |
1.27% |
15.36% |
14.67% |
|
|
Five Years |
4.44% |
4.70% |
6.93% |
9.01% |
|
|
Ten Years |
9.94% |
10.19% |
8.06% |
9.92% |
|
|
Since Inception (April 30, 2012) |
9.67% |
9.92% |
8.46% |
10.03% |
|
The first quarter was a roller coaster ride. At the risk of being accused of succumbing to confirmation bias, it demonstrated again how little value there is in trying to forecast the market, let alone in attempting to position a portfolio to align with those forecasts. The year began with many pundits’ expectations of doom and gloom in the midst of a historically aggressive Fed tightening cycle. “A hard landing is coming… and it’s not priced in!”; “Earnings revisions will push stocks lower in the first quarter…”; “We project a U.S. recession is likely to start around the beginning of 2023 and last through mid-year” – were some of the experts’ predictions we quoted in our last quarterly letter. Because 2022 was by far the worst year for equities (and most other financial assets) since the Great Financial Crisis (GFC) in 2008, we found it hard to tell how much of this doom and gloom was already being priced in. While business activity continued to slow in the first quarter of 2023, and many companies reported challenging environments and lowered guidance for the year ahead, the market seemed to have found its footing and recorded mid-to high single-digit gains across most segments and most geographies. The Fund performed well in January with a gain of 11.2%. On February 2, the most watched technical indicator, the Golden Cross, provided the ultimate buy signal, and momentum investors piled on. That was the top. Then came the January jobs report showing an increase of 517,000 jobs and a drop in the unemployment rate to 3.4%, a 53-year low! Since we are still in the good-news-is-bad-news world, the market went straight down. The Fund lost 3.8% in the month of February, roughly in line with its benchmarks and other equities. On March 9, the 200-day moving average on the S&P 500 Index, another widely used market indicator, broke down, sending a “sell-all” signal to the investing public. Forty-eight hours later the market turned around and went back up. The Fund gained 2.3% in the month of March, ending with a 9.4% gain for the first quarter. We would characterize this as “meh…,” but as Randy Gwirtzman, a colleague and a PM of the Baron Discovery Fund likes to point out – it’s better than a stick in the eye!
Historically, from a performance attribution perspective, stock selection has driven the returns of the Fund. That was true in good times and bad. This quarter, sector allocation was behind the wheel, contributing 565bps to the Fund’s relative returns, while stock selection detracted 353bps. Health Care and Consumer Discretionary were the Fund’s two best-performing sectors, accounting for nearly 100% of outperformance. Not having any investments in Energy, Consumer Staples, Utilities, and Real Estate contributed an additional 134bps, however it was more than offset by the underperformance in Communication Services. This result is better understood when analyzed through the market cap lens. We are and have almost always been underweight large- and giant-cap stocks. The underweight is not due to a top-down decision to allocate more capital to a particular segment of the market. We simply tend to find more Big Ideas among small and mid caps than in mega caps. This hurt our results in the first quarter. While we owned the right large caps, significantly outperforming the Index and generating 445bps of relative outperformance, we did not own enough of them, being 30% underweight. Had we owned more of the tech mega caps that had big bounce backs in the first quarter after meaningful declines in 2022, such as Meta (up 76%), Apple (up 27%), Amazon (up 23%), and Microsoft (up 20%), our excess returns would have been even better.
From a geographic perspective, the quarter was equally unusual. Our developed-market holdings contributed 280bps to our relative results, although in this case, driven entirely by stock selection, while our emerging market investments detracted 292bps. The Fund outperformed the Index thanks entirely to Argentina (namely, MercadoLibre), which contributed 247bps to relative returns. Our best-performing countries in the quarter were the U.S., Argentina, and Canada, which combined to contribute 655bps of relative outperformance. This was partially offset by our investments in India, the U.K., Brazil, and China, which detracted a combined 426bps.
In terms of individual investments and their contributions to absolute returns, we had 24 contributors and 17 detractors. We had a large number of significant winners in the quarter, with five holdings contributing over 100bps each: the Latin-American e-commerce leader, MercadoLibre; the leading artificial intelligence (AI) company, NVIDIA; the leading e-commerce platform, Shopify; the leading electric vehicle (EV) manufacturer, Tesla; and the leading cybersecurity platform, CrowdStrike. Nine additional holdings contributed over 30bps each to absolute returns. In total, 16 of our investments were up double digits or more during the first quarter. This strong performance was partially offset by 11 double-digit decliners, 4 of which detracted between 50bps and 90bps each from performance: Endava, Bajaj, Afya, and ZoomInfo. The good news is that we believe these stocks’ price declines are unlikely to result in permanent loss of capital.
Silicon Valley Bank (SVB), platforms, and digitization
On Wednesday March 8, SVB’s stock was trading at $267 per share, with a market cap of $16 billion. Two days later the price was $0. Despite being headquartered in Silicon Valley with start-ups and world-renowned venture capitalists (VCs) as its clientele, SVB was far from being a start-up. It was a 40-year-old regulated bank with over $200 billion in assets and approximately $175 billion in deposits, making it the 16th largest bank in the U.S. On March 8, after the market close, SVB announced plans to raise $2 billion of capital to “strengthen its financial position.” In that same investor letter, the company claimed to be “well-capitalized, with a high- quality, liquid balance sheet and peer-leading capital ratios” even before the capital raise.
What happened next caught most market participants by surprise and was truly unprecedented. A few large VCs became concerned over the health of SVB and asked each other a logical question: Why would SVB raise capital if they didn’t need it? With plenty of scar tissue left from the GFC, they decided it would be prudent to pull their money out of SVB. All of it. Then, they decided to advise all their start-up clients to do the same, and naturally went to social media to share their action and their concerns with the rest of the world. Well…, in the physical world, when everyone tries to run through the same door, there is obviously no door large enough to fit them. It turns out that in the digital world, it is even worse. The ease of pulling large amounts of money out with a push of a button from a smartphone during any and all hours of the day, combined with the network effects of social media, created an old-fashioned run on the bank. Now, while there is nothing unprecedented about a run on a bank, there was no precedent for the speed of this run on this bank. On Thursday, March 9, SVB’s clients withdrew (or attempted to withdraw) $42 billion – or about $500,000 per second! For comparison, the biggest recorded bank run during the 2008 GFC had clients pulling $17 billion from Washington Mutual over the course of 10 days. After SVB went under in early March of 2023, Signature Bank followed within hours, and First Republic and Credit Suisse needed to be rescued within days.
In the digital economy, network effects are a double-edged sword. Things can go viral and “blow up” at a pace unseen and unimaginable before. ChatGPT acquired 1 million users in five days and 100 million users in less than two months. But the other side of this sword is that a couple of nervous VCs can make a 40-year-old multi-billion-dollar business disappear just as fast.
Although we have never owned legacy banks, we were not unscathed by this calamity, experiencing collateral damage now and possibly in the future. A number of our holdings may be negatively impacted as budgets in the financial services industry are likely to be constrained in the short term, which may, in turn, impact their near-term purchasing decisions and spending plans. For example, Endava, a provider of outsourced IT services and software development, saw its shares drop roughly 20% after SVB collapsed. Approximately half of its revenues come from customers in the financial services industry even though its exposure to banks is only 10% and its exposure to regional banks is less than 2%. Could banks push out projects because they now have other more pressing concerns? Yeah, they could. Would financial services companies stop digitizing, stop moving to the cloud, or decide not to adopt AI because of this crisis? Highly unlikely in our view. And so, while the uncertainty over 2023 financial targets and results has clearly increased, the long-term future of Endava is unaffected and remains bright in our view.
Platforms and AI
In a recent blog post titled “The Age of AI Has Begun,”[4] Bill Gates discussed how AI is the second revolutionary technology he has seen in his lifetime. The first was the graphical user interface of the PC in 1980, which became the basis for Microsoft Windows.
“The development of AI is as fundamental as the creation of the microprocessor, the personal computer, the Internet, and the mobile phone. It will change the way people work, learn, travel, get health care, and communicate with each other. Entire industries will reorient around it. Businesses will distinguish themselves by how well they use it.”
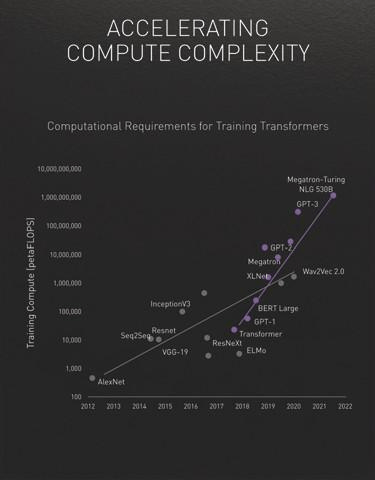
We have followed developments in AI for years. The pace of innovation has significantly accelerated since the introduction of the transformer model in 2017[5] by AI researchers at Google. Their work significantly improved how AI models learn about common relationships in languages, thus building an understanding of context. These models have become the basis of today’s large language models such as Open AI’s GPT-4 (the model behind ChatGPT), which we discussed in some detail in last quarter’s letter. While AI development in general has been progressing at a rapid pace (with model size up 8 times in two years), transformer models are progressing even faster (275 times in two years). The following chart from NVIDIA[6] visually demonstrates this significant acceleration (the purple line shows transformer models):
The potential implications of AI could be profound: increasing information worker productivity from creative professionals to developers; improving decision making at companies of all sizes, making them much more dynamic and data driven; creating new consumer value propositions with more personalized experiences that are based on data and real-time feedback loops; and creating new markets we can’t even dream up today. AI has the potential to drive significant disruption across many industries and entire economies. Similar to how the internet in the late 1990s or the smartphone in the mid-2000s enhanced productivity, shaped new markets, and created trillion-dollar Big Ideas (e.g., Amazon, Apple, Google), we may be in the early stages of the next meaningful platform shift, surfacing new risks and opportunities for businesses. Our initial observations suggest the following:
-
Disruptive change is becoming even more pervasive, increasing the importance of continuously underwriting the investment thesis, which is different from buy and hold. More than ever, we are now in a world of buy, hold, CONSTANTLY VERIFY, and search for disconfirming evidence.
-
Data IS the new oil. The value of proprietary data will increase; AI models will only be as good as the data that feeds them. As a result, the competitive advantages of companies with proprietary data, with the ability to leverage it, will continue to increase.
-
Digitally transforming a company’s business is crucial and will remain management’s top priority. Companies unable to remove silos and build architectures and organizational structures that enable them to harness their data, will be left behind.
-
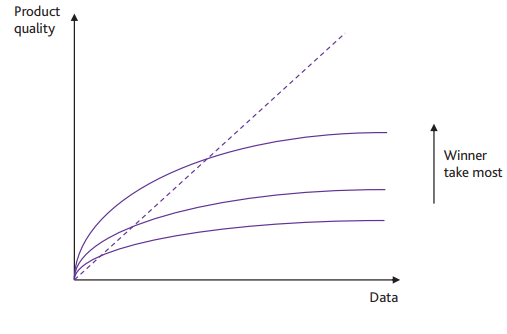
Formation of a virtuous AI cycle in which the scale and uniqueness of a company’s data could create a virtuous cycle among data, product quality, and go-to-market strategies, leading to winner-take-most competitive dynamics. The first-mover advantage would also matter more, as it could help jump start this cycle.
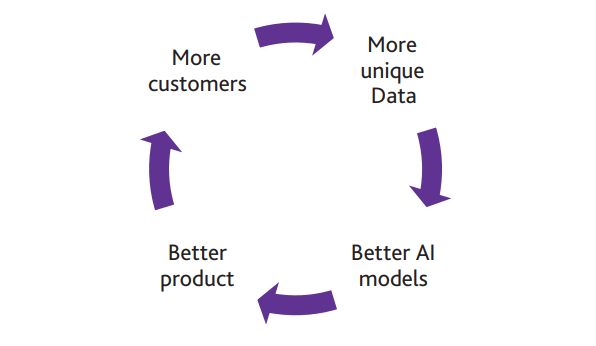
5. Go-to-market and referenceability are increasing in importance because companies that are able to attract more users faster than their competitors are in a better position to reach escape velocity if they can harness and leverage the data generated to their advantage.
6. Market shares of platform businesses are likely to reach even higher levels in the endgame. We believe this would be the case not only for vertical solution providers who already have high market shares (like Veeva, with approximately 80% market share in life sciences CRM), but also for horizontally focused companies. A key question for each company would be the extent to which its product can continuously improve with the scale and uniqueness of its data. If it asymptotes at relatively low scale, the market is likely to be more competitive than if performance improvements would be sustainable for longer, as depicted in the following chart:
The n is more important than the g
As we have described in prior letters, getting the duration of growth right (the ‘n’) matters much more than correctly predicting the rate of growth (the ‘g’). Many companies have been able to grow very rapidly for a few years. Few are able to sustain high growth rates for long periods of time. Those that do become the Big Ideas we are hunting for. While the current macro slowdown and the banking crisis present/create clear headwinds to the g in the near term, we think it also sows the seeds for tailwinds to the n. On the one hand, we are hearing from many companies about lengthening sales cycles, optimizations of ongoing expenses, a requirement to get a C-level approval for purchases, and just a general increase in the level of uncertainty. On the other hand, history and experience suggest that economic downturns drive market share gains for the industry leaders, which strengthens their competitive advantages even further. As AI becomes more pervasive, the leading platforms will likely increase their lead on data, shortening the time to escape velocity. We are already hearing from our companies (who are the leaders in their industries) about consolidation dynamics as customers take advantage of this period of uncertainty to consolidate spend away from point solutions and onto the platforms.
We believe the coming commercialization of AI will serve as a tailwind for many of our companies. The increased importance of digitization should benefit digital-first businesses and those that enable digitization, like Endava, which provides outsourced software development services, and Snowflake, which helps companies remove data silos and become more data driven. CrowdStrike is another good example of a company whose product directly benefits from data. The more data CrowdStrike acquires, the better it becomes at catching cybersecurity threats, which in turn helps the company win more customers, thus driving more data onto the platform, and the cycle continues.
While near-term uncertainty remains high, we have even greater conviction in the long-term prospects of our companies. We have no insight, or even a view, on whether the economy is headed into a recession or a prediction on how the market, or the Fund, will perform in the second quarter or for the rest of 2023. Our pattern recognition continues to suggest, however, that this period of time will prove to be a good entry point for investors in the not-too-distant future.
Percentage of time Fund outperformed over different time periods from inception through March 31, 2023
|
Rolling Return Period |
1 Month |
3 Months |
1 Year |
3 Years |
5 Years |
10 Years |
|
Outperformance vs. MSCI ACWI Index |
60% |
62% |
69% |
83% |
94% |
100% |
|
Outperformance vs. MSCI ACWI Growth Index |
56% |
59% |
67% |
78% |
93% |
100% |
|
Outperformance vs. Morningstar World Large-Stock Growth Category Average |
57% |
60% |
68% |
84% |
94% |
100% |
|
Outperformance vs. Lipper Global Multi-Cap Growth Category Average |
58% |
62% |
68% |
83% |
94% |
100% |
The performance data quoted represents past performance. Past performance is no guarantee of future results. The indexes are unmanaged. Index performance is not Fund performance; one cannot invest directly into an index.
Sources: BAMCO, MSCI, Inc., Morningstar Direct, and Refinitiv.
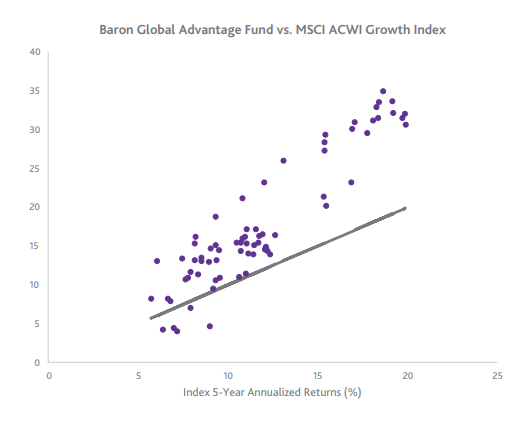
5-year rolling return scatterplot charts as of March 31, 2023
5-year rolling return scatterplot charts as of March 31, 2023 (Sources: BAMCO and MSCI, Inc.) 5-year rolling return scatterplot charts as of March 31, 2023 (Sources: BAMCO and MSCI, Inc.) Table II. Top contributors to performance for the quarter ended March 31, 2023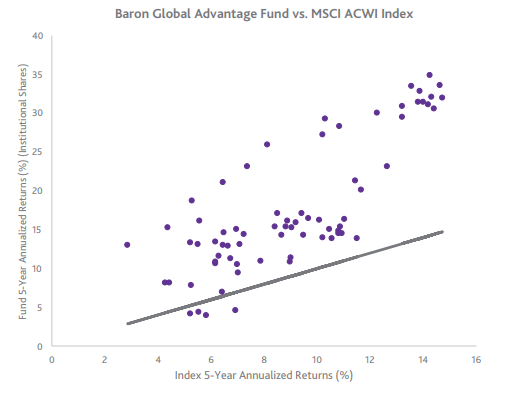
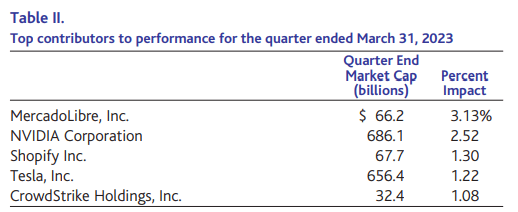
The stock of MercadoLibre, Inc., (MELI) the dominant e-commerce platform in Latin America, rose 55.8% during the first quarter. The company reported a significant fourth-quarter earnings beat, driven by strong performance on essentially all key drivers of operating margins across both the commerce and fintech segments, including higher fulfillment penetration, stronger adoption of advertising solutions, lower loan loss provisions on the credit business, and operating leverage driven by economies of scale. Net revenue grew 57% year-over-year in constant currency, total payment volume was up 80% and the operating margin reached 11.6%. On its earnings call, the company suggested these drivers will continue to generate sequential margin expansion in the coming quarters and years, and we believe retrenchment by some top e-commerce competitors could lead to a possible acceleration of MercadoLibre’s market share growth, especially in Brazil. We believe MercadoLibre will be the dominant player in a Latin American e-commerce industry that remains early in its growth life cycle, driven by the relative low e-commerce penetration in the region. We remain shareholders.
NVIDIA Corporation (NVDA) is a fabless semiconductor mega-cap company and global leader in gaming cards and accelerated computing hardware and software. Despite subdued demand for gaming cards due to an ongoing PC slowdown and inventory correction, shares of NVIDIA rose 90.1% during the first quarter as a result of material developments in generative AI as evidenced by the release of ChatGPT and GPT-4. These technologies hold the promise of enabling significant productivity gains across domains from content creation, coding, and even biologic discovery. During its annual GTC conference in March, NVIDIA announced new products that expand its addressable market such as the L4 chip, which opens the opportunity for video processing, representing 80% of internet traffic. We continue to believe NVIDIA’s end-to-end AI platform and leading market share in gaming, data centers, and autonomous machines, along with the size of these markets, will enable the company to benefit from durable growth for years to come and therefore remain shareholders.
Shopify Inc. (SHOP) is a cloud-based software provider for multi-channel commerce. Shares rose 38.1% in the first quarter as a result of a broader rebound in growth stocks and the company’s solid fourth quarter results. It had 13% year-over-year growth in gross merchandise value and 26% growth in revenue, driven by increasing adoption of the company’s solutions including payments, Shopify Capital, Shopify Markets, and Shop Pay. Shopify also continued to show an impressive velocity of product innovation, with recent updates across fulfillment (Shop Promise), marketing (Shopify Audiences), and Enterprise (Commerce Components by Shopify). We remain shareholders due to Shopify’s strong competitive positioning, innovative culture, and long runway for growth as it still holds less than a 2% share of global commerce spending.
Tesla, Inc. (TSLA) designs, manufactures, and sells EVs, related software and components, and solar and energy storage products. After being our top detractor in the fourth quarter, when its price fell 53.6%, the stock reversed course and was up 68.4% in the first quarter of 2023. The about-face was caused by a rapid shift in investor sentiment, as investors now expect Tesla to continue growing rapidly while maintaining industry-leading margins despite a potential recession, supply-chain challenges, increased competition in China, and price adjustments. In addition, after devoting considerable time to reorganizing Twitter post-acquisition, CEO Elon Musk has re-established his commitment to Tesla, while a management presentation during its analyst day provided visibility into the broad quality of talented professionals leading Tesla. We expect Tesla to continue to lead the electrification of the automotive and energy storage markets through its vertical integration, scale, and cost leadership. As long-term shareholders, we have witnessed Tesla increase deliveries from practically zero to over 1.3 million units while proving it can reduce costs and rapidly expand its product line and manufacturing footprint. We also expect Tesla’s next platform to have a significant impact on the company’s results. We remain confident in Tesla’s fundamentals and management team, and we believe that with still less than a 2% market share, the company remains well positioned to enjoy a long runway of growth as the market shifts to EVs.
CrowdStrike Holdings, Inc. (CRWD) provides cloud-delivered, next generation security solutions via its Falcon platform consisting of end-point protection, advanced persistent threat, security information, event management, and cloud workload protection. Shares increased 30.3% after the company posted fourth quarter results that beat Street expectations with 48% year- over-year revenue growth on the back of better net new annual recurring revenue of $222 million, despite the continued elongation of sales cycles that started two quarters prior. The company noted its average pricing remains stable, win rates are strong, and it added a record number of net new customers as initiatives targeting small to medium-sized businesses and mid-market began to bear fruit. The enterprise business continued to see strength, with gross retention rates at all-time highs and dollar-based net retention rates above 125%. The company also provided guidance ahead of expectations across revenue, operational performance indicators, and free cash flow, embedding the assumption of elongated deal cycles. With its leading competitive positioning in cybersecurity, the growing threat landscape, its unique single-agent architecture, and its platform approach, we believe CrowdStrike is well positioned to compound at high growth rates for years and therefore we remain shareholders.
Table III. Top detractors from performance for the quarter ended March 31, 2023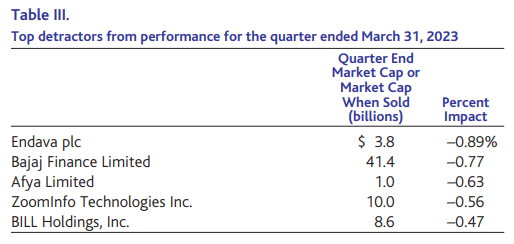
Endava plc (DAVA) provides consulting and outsourced software development services for business customers. Shares declined 12.2% during the first quarter as a result of growing investor concerns over the potential near-term demand implications resulting from the banking crisis, given that 50% or more of Endava’s revenue comes from financial services firms. In addition, shares were impacted by the company reducing its financial guidance for fiscal year 2023 to reflect slower bookings as macroeconomic uncertainty weighed on client decision making in December. Nevertheless, the company reported solid quarterly results, with 30% revenue growth and 26% EPS growth. Management noted that bookings have improved in the first couple of months of 2023, and it expects annualized revenue growth to return to greater than 20% fairly quickly. While near-term uncertainty has increased, we remain investors because we believe Endava will continue gaining share in a large global market for IT services for years to come.
Bajaj Finance Limited is a leading non-banking financial corporation in India. The stock declined 13.5% during the quarter due to a near-term slowdown in business activity amid rising competition in mortgage lending and moderating consumer spending in India. We believe Bajaj remains well positioned to benefit from positive long-term demand trends for consumer financial services including mortgages, personal and credit card loans, and vehicle financing given India’s low penetration of household debt as a percent of GDP, which is still less than 15% (compared to over 60% and 75% in China and the U.S., respectively). We retain conviction in Bajaj given its best-in-class management team, robust long-term growth outlook, and conservative risk management frameworks. We believe Bajaj is well positioned to gain market share from capital constrained public sector banks, while also deploying conservative risk management frameworks to generate superior risk-adjusted returns for shareholders.
Afya Limited (AFYA) is a Brazilian for-profit education company specializing in medicine, including undergraduate and graduate coursework, residency preparatory and specialization programs, and digital solutions for physicians. Shares declined 28.5% during the first quarter due to investor concerns over potential regulatory changes in the Brazilian education system that could lead to increasing competitive pressures. We remain shareholders and believe these investor concerns have been overly discounted. Afya continues reporting solid financial results, with fourth quarter revenue growth of 18% year-over-year and adjusted EBITDA margins of 41%, while providing a 2023 outlook above investor expectations, with projected revenue growth of 20% and stable EBITDA margins. We anticipate continued long-term appreciation driven by Afya’s pricing power, maturing undergraduate program, and expansive digital offerings.
ZoomInfo Technologies Inc. (ZI) provides go-to-market business intelligence software. Despite reporting 47% year-over-year revenue growth (41% organic), 41% adjusted operating income margins, and 42% free-cash-flow margins for 2022, shares declined 18.0% during the first quarter after the company guided for a slowdown in revenue growth driven by increasing macroeconomic uncertainty, elongating sales cycles, slower upselling to existing customers, and a slowdown in seat expansion. While near-term uncertainty has increased, we believe ZoomInfo’s competitive positioning remains strong and the opportunity ahead is significant. We retain conviction and believe that ZoomInfo will benefit from long-duration growth as it has only about 35,000 customers out of a 700,000 business-to-business (B2B) opportunity. New products in talent and marketing add optionality, and we believe ZoomInfo can become a much larger company over time as it grows into its $100 billion total addressable market.
BILL Holdings, Inc. (BILL) is a leading provider of cloud-based software that simplifies, digitizes, and automates complex back-office financial operations. The company reported solid quarterly results with revenue growth of 66% year-over-year and adjusted operating margins of 11.8%, both above Street expectations. However, the stock declined 25.5% during the quarter due to a forward outlook that missed investor forecasts. In particular, macro related pressure on small- to medium-sized business (SMB) spending led to lower total payment volume per customer and somewhat fewer net new customers. In addition, while Street analysts do not expect the SVB failure to have a direct impact on BILL’s business, they have expressed some concerns that the fallout will further dampen the backdrop for SMBs.
Despite the potential near-term macro-related headwinds, we retain conviction as the digitization of B2B payments is a powerful secular trend with a long runway for continued growth and BILL remains well positioned to be a winner in the SMB market.
Portfolio Structure
The portfolio is constructed on a bottom-up basis with the quality of ideas and conviction level having the most significant roles in determining the size of each individual investment. Sector and country weights are an outcome of the stock selection process and are not meant to indicate a positive or a negative view.
As of March 31, 2023, the top 10 positions represented 47.9% of the Fund and the top 20 represented 75.8%. As we articulated in prior letters, we have now returned to a more concentrated portfolio as the market volatility enabled us to consolidate the portfolio on our highest conviction ideas (top 10 and top 20 positions were 45.9% and 73.0% in December 2022, and 42.5% and 61.9% in December 2021, respectively). We ended the quarter with 39 investments (down from 41 at the end of December 2022).
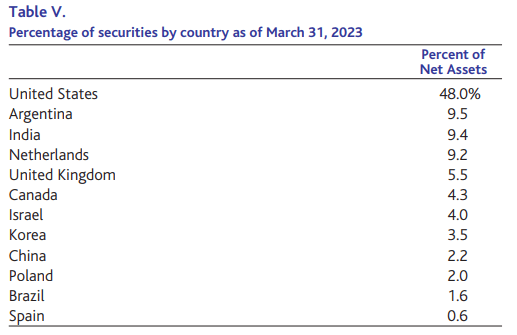
Our investments in the Information Technology, Consumer Discretionary, Health Care, Financials, Industrials, and Communication Services (as classified by GICS) sectors represented 98.3% of the Fund’s net assets. Our investments in non-U.S. companies represented 51.9%, while companies classified as being in emerging markets were 18.7% of net assets. An additional 9.5% is invested in companies based in Argentina, which falls outside of MSCI’s developed/emerging/frontier markets framework.
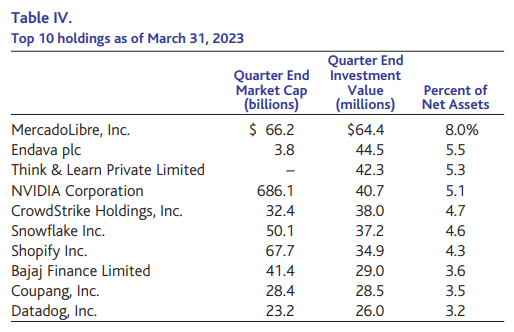
Exposure By Country
Recent Activity
During the first quarter, we reduced 15 positions and sold 2 investments to fund redemptions and further consolidate the portfolio on our highest conviction ideas. We sold the Uruguayan payments company DLocal (DLO) and the liquid biopsy test provider Guardant Health (GH). While both companies remain potentially Big Ideas, several recent company-specific developments increased the range of outcomes and reduced our conviction level, pushing out the timeline for our thesis playing out.

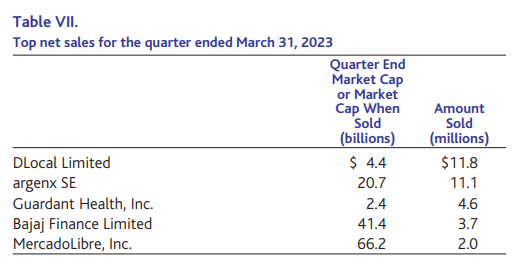
Our largest sale in the first quarter was DLocal Limited. Although our research and due diligence suggest that the allegations of fraud described in the short seller’s report are most likely without merit, we believe the probability of a business impact on the company by customers reacting to the report has increased considerably, prompting us to reallocate capital to other investments. We also sold our position in Guardant Health, Inc. after the company published disappointing results of its Eclipse trial, which we believe reduces the probability of wide adoption for its early detection blood test for colorectal cancer.
Outlook
First Quarter 2020 – For the first time in 100 years, we are reintroduced to a global pandemic.
First Quarter 2021 – The reopening trade leads to significant outperformance for “value” sectors (e.g., energy, legacy banks, and airlines) for the first time in over a decade.
First Quarter 2022 – Russia invades Ukraine and further exacerbates COVID-19-driven supply-chain challenges, pushing up inflation and compressing the pace of the Fed’s tightening cycle.
First Quarter 2023 – SVB, the 16th largest bank in the U.S., collapses after a run on the bank, the largest bank crash since 2008. The 167-year-old financial institution, Credit Suisse, is sold for $3.2 billion to UBS in a takeover brokered by the Swiss National Bank.
Care to offer the outlook for the first quarter of 2024? We sure do not.
Skeptical investors often ask, if we have no confidence in forecasting the next three months or the next year, how can we have confidence in forecasting 5 or 10 years into the future? While this skepticism is understandable, we believe it is misplaced. Short-term stock price fluctuations (and company fundamentals) are disproportionately affected by macro factors and factors outside a company’s control. We believe most of these factors are impossible to predict accurately with any consistency. However, it turns out that a business’s uniqueness, the sustainability of its competitive advantages, its management’s ability to prudently allocate capital and to earn high rates of return on the company’s investments can be analyzed and therefore forecasted far more accurately over the longer periods of time. Sure, qualitative things like a company’s culture, the strength of its management team, and even the disruptive change analysis are all subjective; assessing them requires both analytical experience and a healthy margin of safety, but at the end of the day, there are only a handful of variables that go into the intrinsic value equation:
-
How big is the opportunity?
-
What market share can the company reasonably expect to get?
-
How economically profitable would this business be at maturity?
-
What is the cost of capital?
-
And what is the terminal growth rate?
These are the variables that long-term owners of a business care about and spend their time researching. Over the last three months, we believe these variables have been moving in the right direction for most of our portfolio companies. Interestingly, although the Fed’s rhetoric remains hawkish with “more inflation fighting left to be done,” the 10-Year U.S. Treasury yield has fallen from around 3.9% at year-end 2022 to around 3.4% as we write this letter. Similarly, real rates, as measured by the yield on 10-Year U.S. TIPS have dropped from around 1.6% to around 1.1% over the same period. Just sayin’….
Every day we live and invest in an uncertain world. Well-known conditions and widely anticipated events, such as Federal Reserve rate changes, ongoing trade disputes, government shutdowns, and the unpredictable behavior of important politicians the world over, are shrugged off by the financial markets one day and seem to drive them up or down the next. We often find it difficult to know why market participants do what they do over the short term. The constant challenges we face are real and serious with clearly uncertain outcomes. History would suggest that most will prove passing or manageable. The business of capital allocation (or investing) is the business of taking risk, managing the uncertainty, and taking advantage of the long-term opportunities that those risks and uncertainties create.
We are optimistic about the long-term prospects of the companies in which we are invested and continue to search for new ideas and investment opportunities while remaining patient and investing only when we believe the target companies are trading at attractive prices relative to their intrinsic values.
Sincerely,
Alex Umansky, Portfolio Manager
|
Footnotes † The Fund’s 3-, 5-, and 10-year historical performance was impacted by gains from IPOs. There is no guarantee that these results can be repeated or that the Fund’s level of participation in IPOs will be the same in the future. 1. The MSCI ACWI Index is designed to measure the equity market performance of large and midcap securities across 23 Developed Markets (DM) and 24 Emerging Markets (EM) countries. The MSCI ACWI Growth Index is designed to measure the equity market performance of large and mid cap securities exhibiting overall growth style characteristics across 23 Developed Markets (DM) countries and 24 Emerging Markets (EM) countries. MSCI is the source and owner of the trademarks, service marks and copyrights related to the MSCI Indexes. The indexes and the Fund include reinvestment of dividends, net of foreign withholding taxes, which positively impact the performance results. The indexes are unmanaged. Index performance is not Fund performance; one cannot invest directly into an index. 2. The performance data in the table does not reflect the deduction of taxes that a shareholder would pay on Fund distributions or redemption of Fund shares. 3. Not annualized. 4. GatesNotes.com, March 21, 2023 5. Vaswani, A., N. Shazeer, N. Parmar, J. Uszkoreit, L. Jones, A. Gomez, L. Kaiser, and I. Polosukhin, “Attention Is All You Need,” arxiv.org, December, 6, 2017. 6. NVIDIA Investor Day 2022 presentation materials. |
Original Post
Editor’s Note: The summary bullets for this article were chosen by Seeking Alpha editors.
Read the full article here
