Q1-2023 Positive Earnings Surprises
To date, 85% of the S&P 500 (SP500) has reported earnings so far, and it hasn’t been Armageddon. On the contrary, the surprise has been the best in 13 years, according to FactSet. 79% of those reporting had positive earnings surprises, way above the 10 year average of 73% and slightly above the 5 year average of 77%.
Either companies have become masters at sandbagging or perhaps, too conservative following 2022’s bear market. Nonetheless, this has been an impressive quarter compared to estimates so far, and among the 15% left, semiconductor and AI behemoth Nvidia (NVDA) should also report better than expected results in my view, even after 19 positive revisions, on 5/24.
Importantly, besides the 79% of the 85% who reported positive surprises, which itself is a pretty solid number, the magnitude of beats is very high. Initially, analysts had estimated an earnings decline of 6.7% and so far the decline has only been 2.3%, which shows that for once analysts have been too conservative. Here’s a report from Morgan Stanley, from Dec 2022, which felt that analysts were too complacent for not estimating lower, but clearly instead of a rude awakening, it was a pleasant surprise with a whopping 10 out of 11 sectors of the S&P 500, beating estimates!
Inflation, which everyone hates and loves to deride, was a positive for companies’ top lines. Revenue beats were as high as earnings beats with 75% beating estimates, substantially higher than the 63%, 10 year average and also above the 67%, 5 year average. The revenue beats were not as strong as earnings beats, with the total revenue beats being 2.7% above estimates, but still a lot above its 10 year average of 1.3%, and above its 5 year average of 2%. It appears inflation this year, as measured by the core CPI at a robust 5.6% clip, is still helping corporate top lines.
What can we expect for the rest of the year?
FactSet bottom up estimates from analysts suggest a third quarterly decline in Q2-23 of 5.7%, after declines in Q4-22 and Q1-23. However, they expect a small uptick in Q3 of 1.2% and Q4 to come roaring back in the green to the tune of 8.5%. In my estimate, the large Q4 increase looks possible given the lower Q4-22 base. To round off the year, the bottom up prediction for the S&P 500 is 1.2% higher for earnings and 2.4% higher for revenues. Earnings are expected to grow slower, suggesting that expenses are going to eat into profits, seemingly, even top line inflation has not been enough to conserve profits; higher wages and other costs are going to take their toll at the expense of profits.
Based on the 1.2% increase, FactSet’s forecasted EPS for the S&P 500 for 2023 is $221.4 and $246.7 for 2024. I believe these are fairly reasonable estimates given the positive surprises for Q1-2023.
I complied a set of 60 companies’ forward EPS estimates for 2023, ranked by market cap, representing 62% of the S&P 500 (NYSEARCA:SPY) using data from Finviz and Seeking Alpha, as a second set of eyes.
Top 60 Companies of the S&P 500 (Finviz, Seeking Alpha, Fountainhead)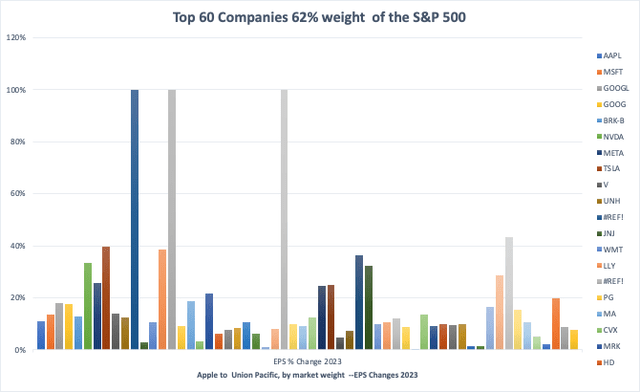
The chart above shows forward estimates from Apple (AAPL) to Union Pacific Corporation (UNP) and represents 62% of the S&P 500. I removed Amazon (AMZN) and Intel (INTC), which were showing massive jumps of 178% and 284%, respectively, to avoid skewing the data. Among the top ten heavyweights, Google (GOOG) (GOOGL), Nvidia, Meta Platforms (META) and Amazon had earnings drops in 2022 and are rebounding in 2023. The largest drop comes from Exxon (XOM) at #12 of 4%, after a massive 146% gain in 2022. From the chart above, analysts expect a vast majority of the larger cap companies to report positive YoY, EPS growth in 2023 – from a range of 0.3% to 43%, suggesting that FactSet’s analysis is directionally accurate and representative – no panic on the earnings front at least.
I had looked at a low S&P 500 EPS estimate of $195 from Morgan Stanley last December. Clearly, the $195 EPS from Morgan is highly unlikely to happen and I also believe that the final number for 2023, could be closer to last year’s actual EPS of $219. Yes, if earnings come in flat, around $222 per share; at the current S&P 500 level of 4,135 that’s a forward P/E of around 18.6 and if earnings come in around $230 that’s a forward P/E of only 18, which is comforting and indicates that the S&P 500, should see support at lower levels. A P/E of 18 is slightly expensive with the 10 Year treasury around 3.5%, but reasonable if the 10 year drops to 3% to 3.25%. The Bottom line – if the S&P 500 EPS stays flat, we are slightly over priced and in my estimate likely to see support at even 5% drops.
What has moved the market during earnings season?
With all the positive news from a better than expected earnings season, the markets didn’t move much, with the S&P 500 at 4,124 on April 1st crawling to 4,135 on May 5th.
Here are the daily changes and the daily % changes on the S&P 500 from April 1st to May 5, 2023:
S&P 500 Earnings Season Daily Changes (Yahoo Finance, Fountainhead)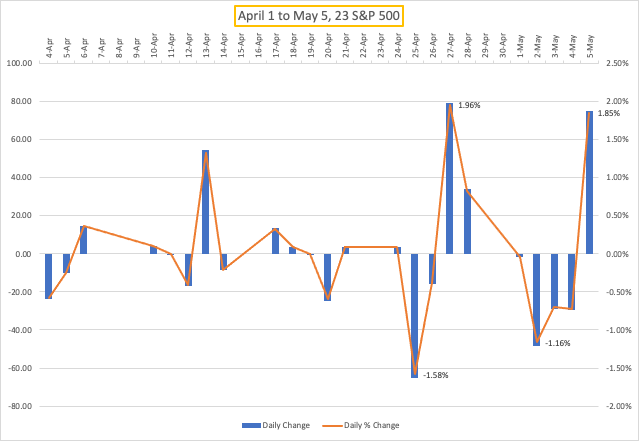
The narrative shifted to the markets preferring the health of the economy over inflationary concerns.
During this period, the highest daily gain was 1.96% on April 27th, following Meta and Microsoft’s (MSFT) earnings surprises.
The second biggest gain of 1.85% on May 5th, was on a higher than estimated, Non-Farm Payroll report of 253,000 jobs gained, with an Average Hourly Earnings gain of 0.5% MoM or 4.4% YoY, beating estimates of 0.3% and 4.2%, strongly indicating that wage inflation was entrenched and sticky and way, way beyond the somewhat mythical target of 2%. And the market loved it, rewarding the S&P 500 with a 1.85% increase that day. In early February, when the January payrolls report showed a massive gain on 535,000 jobs, inflation fears leapt front and center, with the S&P 500 dropping 1% that day and 0.7% the day after.
During this period, April 25th was the worst day in the markets – a drop of 65 points or 1.58% on banking contagion fears led by the huge drop in First Republic which saw several trading halts as traders braced for the worst outcome of seizure and sale.
The second largest drop was on May 2, of 1.16% – here we go again, with PacWest Bancorp (PACW) and Western Alliance Bancorporation (WAL) routed by panicked investors and short sellers.
How the narrative has shifted. An inflationary payrolls report caused no damage; instead markets vaulted higher, cheering the increase in jobs, indicating that the fear of recession had replaced inflationary concerns. Further, the markets dropped on banking contagion fears, which were clearly recessionary.
The Labor Markets and the chances of a recession
Consistent with a decline in S&P 500 earnings, GDP too, showed inflation adjusted growth of only 1.1%, much lower than the 2.3% growth in Q4-2022.
The chart below shows the unemployment rate by month from 1960 to April 2023.
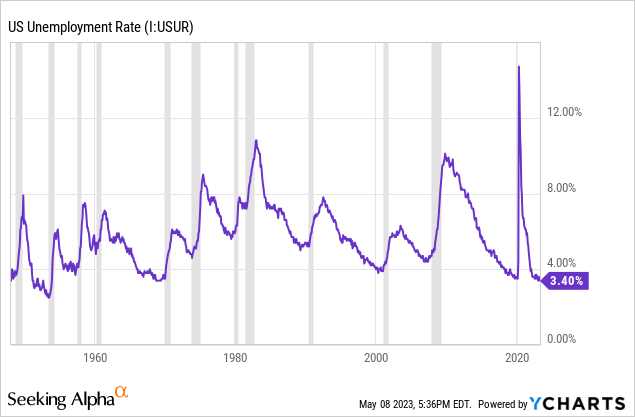
This is one of the strongest labor markets in the last 50 years for sure. Unemployment usually peaks after recessions are over, when interest rates declines have given the economy enough impetus to rise and consequently start improving. The past recessions have had unemployment rates that were far higher. If we were to have a recession, I believe that the closest comparable would be the short lived 1990-1991 recession, which lasted only 87 days.
This is a good Forbes article, on the 1991 recession, titled “What Can the 1991 Recession and S&L Crisis Tell Us About Today?”. Here are some of the important points. Emphasis mine.
This was one of the shallower recessions in modern history: GDP contracted just -0.2% in nominal terms, with the S&P 500 experiencing a selloff of 20%. This compares with declines of -3.3% and -57%, respectively, during the 2009 Global Financial Crisis (GFC).
This recession differs from others because it lacked a clear single catalyst, such as the housing crisis or the tech bubble. It was led by three major themes: aggressive policy tightening by the Fed, the savings and loan (S&L) crisis, and the oil shock associated with the first Gulf War.
The Fed cut rates by 75 basis points after the October 1987 Black Monday stock market crash, the only single-day bear market (a drop of -20% or worse) in history. The cycle’s low for inflation and interest rates came in early 1987, with Core CPI troughing at 3.8% and moving to 4.5% by late 1988. Acting quickly and aggressively to avoid the double-digit inflation of the early 1980s, the Fed hiked rates 387 basis points, peaking at 9.75% in early 1989.
The S&L crisis was also beginning. From 1986 to 1989, 296 savings and loan associations failed. Many of their assets were in fixed rate loans, often backed by real estate. To cover the gaps caused by higher costs from rising interest rates and the static returns they were earning, S&Ls began engaging in more speculative – and risky – activities. The verdict of history: bad idea.
Doesn’t this sound all too familiar? I believe that, whether we have an earnings or economic slowdown, the correction or recession is likely to be mild for four reasons. a) Earnings have not turned out to be as bad as expected. b) The labor market is the strongest in modern history and even a creep back of the unemployment rate up to 4.5% to 5% is still historically low. c) The government has managed to avert a banking contagion and crisis by swift action – sure, there will be credit contraction, a huge slowdown in commercial real estate lending and some banks will be shuttered, but the resolve to face this and solve it in an orderly way is a big plus. d) With the current 5% to 5.25% Fed Funds rate, the Feds have enough ammunition to take their foot off the interest rate pedal and decrease rates when necessary.
Key Takeaways
A Rangebound Market: My best estimate is for the S&P 500 earnings to come in flat, around $222 per share, which at 4,135 is a forward P/E of around 19. If earnings come in around $230 that’s a forward P/E of 18. These are higher than the 1960-2022, historical averages of 16.9, but close to the 2000-2022 year average of 19.3 – essentially the market is not unusually overpriced, nor is it low enough to jump in.
S&P 500 P/E Ratios (SternNYU, Yahoo Finance, Factset, Nasdaq, Fountainhead) S&P 500 Average Annual P/E Ratio (SternNYU, Yahoo Finance, Factset, Nasdaq, Fountainhead)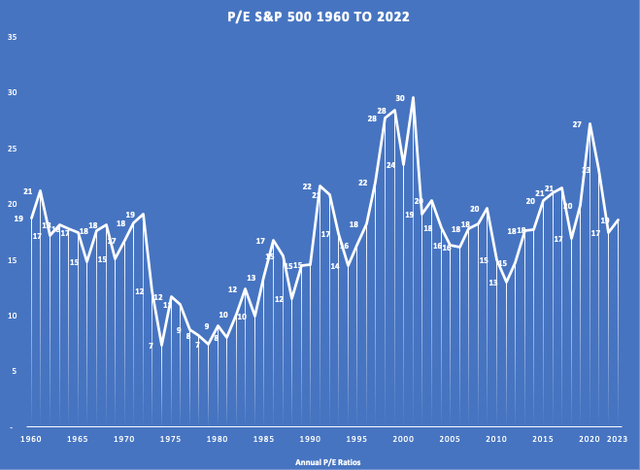

In spite of a better than expected earning season, the S&P 500 went from 4,126 to 4,136. No change! That suggests that a lot of positives are pretty much in the price and unless there is a sea change in earnings or the economy, the upside is likely to be limited.
Earnings improvements are just beats, Q3 and Q4 still need to outperform. These are still mediocre earnings, and hits are being met with irrational bounces and without any clear indication of a 2H Turnaround. For example, Meta’s Q1-23 EPS came in at $2.20, beating estimates by $0.25, but still $0.52 or 19% lower than Q1-22 earnings of $2.75 – but the stock went up an exuberant 10% that day.
So, while the full year forecasts are positive, huge performances are still expected from Q3 and Q4 and remember Q4 is likely to show out performance only because Q4-22 was terrible.
Inflationary concerns seem to be in the rearview mirror. The hot payroll report of May 5th, with the wage growth of 4.4% should have sent everyone scurrying for cover. Instead, it was a sigh of relief that 253,000 jobs were created, and that this was not a recessionary report. Clearly, the narrative has shifted towards avoiding a recession and living with moderate to high inflation; I believe this is the correct way to invest in this market. The chances of a severe recession are low in my opinion looking at the strength of the labor market, and given the similarities with 1990-91, I feel that a recession if it happens, would be mild and short-lived.
The day the Feds decrease rates will not be good for the market. It’ll be a sign that they are throwing in the towel and trying to prevent the country from a recession.
Economic indicators to set the tone for the next two months: There are no more significant earnings between now and mid-July expect for Nvidia’s; Economic indicators will dictate market movements without earnings providing any cover.
The banking crisis is far from over: A Gallup poll on Thursday, May 4, showed that nearly half of Americans were at least somewhat concerned about the safety of their money in US banks, and according to this report it was actually higher than the number after Lehman’s collapse. The Feds in the past two months have shown remarkable resolve in protecting depositors money, but the tightening of credit conditions is a foregone conclusion. The chances of a JPMorgan Chase (JPM), the money center behemoth, approving property loans with the alacrity of a regional bank are very low.
From Berkshire Hathaway Inc.’s (BRK.A) (BRK.B) annual meeting last weekend, Mr. Buffett and Mr. Munger stated that the banks were not out of the woods yet. They spoke about the weakness in the commercial real estate market, which is the wheel house of the regional banks, mentioning how empty spaces and high interest rates would cause of lot of pain. Something similar to what the S&L’s went through in the 1990-1991 recession.
Marco Kolanovic, chief strategist at JPMorgan remains steadfastly bearish; The mega bull turned bear in 2022, after realizing that the Feds were serious about increasing rates and tackling inflation. He believes that the worst is far from being over, voicing concern that investors are expecting interest rate cuts too early. He too, believes that an interest rate drop is a sign of the Feds throwing in the towel, and a sign of an impending recession, which no one in his right mind should be looking forward to.
Kolanovic also spoke about the poor breadth in the market. In my opinion, in uncertain times like the current bear market, breadth has always been poor. defensive consumer staples have always been the preferred safe haven. It just so happens in this case, that the preferred safe heavens are market bellwether’s like Google, Microsoft, Apple, Amazon and Meta, which are both growth and staples we can’t do without. I have two arguments against looking for breadth just for the sake of it. a) In an inflationary environment, you do not want to park your money in defensive utilities or beaten down cyclicals, which barely get you more than 5%, when you have alternatives like money market funds and CDs, that are a lot safer. b) It is far more risky to invest in hot growth, Cathie Wood types of stocks, which comprises the iShares Russell 2000 ETF (IWM). Sure, the 10 highest market caps are overcrowded trades, but the alternatives are not promising either. In Peter Lynch’s world, it would have been called “Diworsification”. So a lack of breath right now is not such a bad thing in my opinion.
I believe that an improving Stagflation scenario could be a very likely outcome for the rest of 2023.
- No further increases rate hikes in 2023.
- Instead, tighter bank credit would reduce activity and stabilize or reduce inflation.
- Reduced demand would lead to a reduction in prices that were being passed on to the consumer, further reducing inflation.
- It would also lead to deterioration of profit margins for companies, which could lead to layoffs.
- Lower interest rates only in 2024.
- If we have a recession, I expect it to be similar to the shorter and milder recession we had in 1990-1991.
Trading/portfolio strategy
I expect the markets to be range bound, with limited upsides and decent earnings to provide support at lower levels, especially since I believe that the market is just slightly overpriced.
Instead of trying to time corrections, I’ve had some success in being conservative and buying only on declines.
Here are some recommendations I made to buy on declines of 10% and 20%, which worked.
- Advanced Micro Devices (AMD) when the price was $98, I bought around $86.
- Confluent (CFLT) when the price was $26, average purchase around $21.
- Arista Networks (ANET) when the price was $158, my average purchase is at $136. I’m still accumulating this steadily.
The one that got away – Datadog (DDOG) I was too conservative, recommended it as a great company to buy at $55 when the price was $67, but the results came out much better than expected and I never got my price.
I’m recommending Splunk (SPLK), between $80 and $85 and Qualcomm (QCOM) around $108.
My entry point for the S&P 500 ETF is around $390-395 and for the QQQ Trust ETF (QQQ), which tracks the Nasdaq (COMP.IND) is around $310-$315.
Read the full article here
