Food is our common ground, a universal experience. – James Beard
Twitter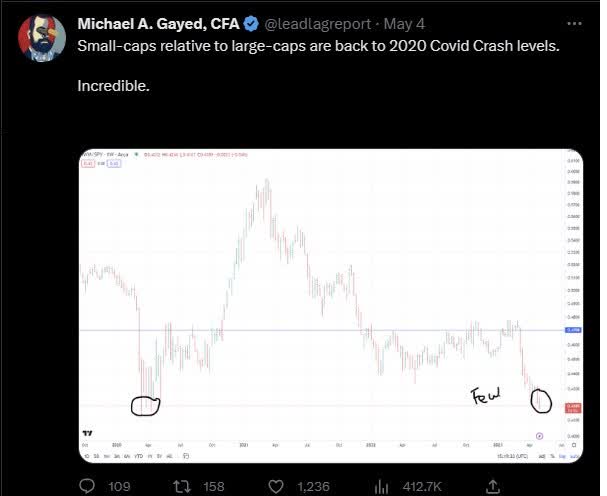
At the turn of this month, I put out a tweet highlighting how the small-cap/large-cap ratio had recently collapsed to levels last seen during the 2020 pandemic crash. After forming a bottom at these levels, we then saw a reversal in the ratio. If you think we could see a recurrence of the same, and you’re looking for opportunities in the small-cap space, you may consider exposing yourself to John B. Sanfilippo & Son, Inc. (NASDAQ:JBSS).
This company is a 4th generation family-managed North American-based business, which is currently perceived to be one of the largest nut-processing firms in the world (close to 50% of the product mix comes from walnuts, cashews, and mixed nuts).
FY22 Presentation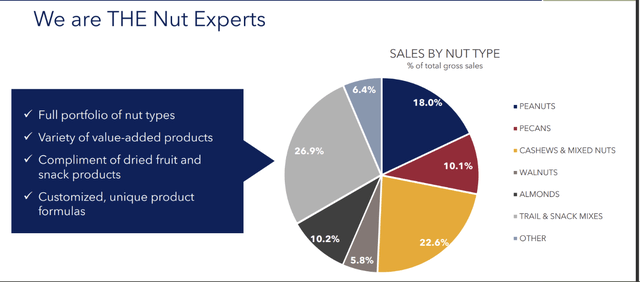
Evidently, the product profile (just nuts) may come across as rather unidimensional in nature, but what JBSS does, it does very well. What helps is that it runs a vertically integrated nut-processing operation for its portfolio of pecans, peanuts, and walnuts. Besides, its purchasing cohort has over 25 years of experience, which can come in very handy during commodity procurement initiatives. Crucially, in recent years, JBSS has done well to reduce some of its non-core distribution channels and focus on what it does best. Over 10 years back, it was catering to the export market, but this has now gone out of the window, even as it has pressed the pedal with its consumer distribution initiatives.
FY22 Presentation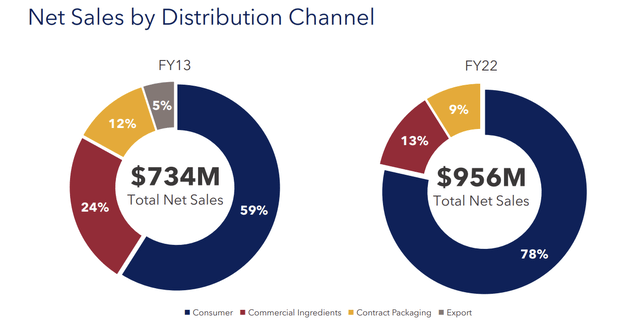
If you’ve been a follower of The Lead-Lag Report Twitter account, you’d note that I’ve put out plenty of content in recent years highlighting how inimical food inflation has proven to be. But such is the pricing strength that John B. Sanfilippo & Son, Inc. enjoys that it has been able to grow group EBITDA for yet another year (prior to FY22, EBITDA had improved for 3 straight years).
FY22 Presentation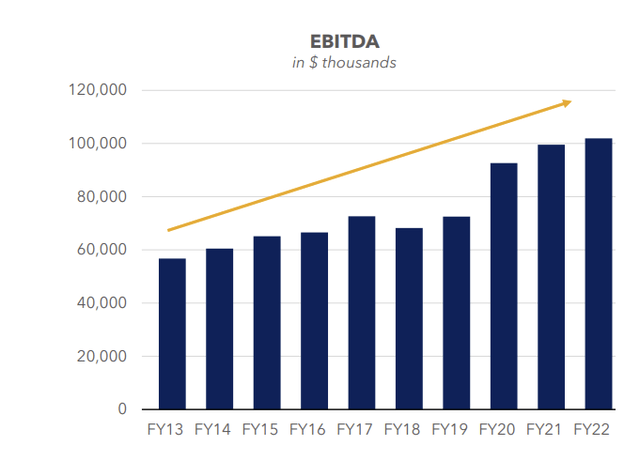
Another impressive facet of JBSS is how it has managed to reduce its financial leverage, even as the EBITDA has continued to improve. The financial debt to EBITDA ratio which was over 1x before FY19 has more than halved and currently stands at less than 0.5x. As the Fed continues to remain hawkish, small-caps with innately lower leverage profiles will receive plenty of attention from the smart money.
YCharts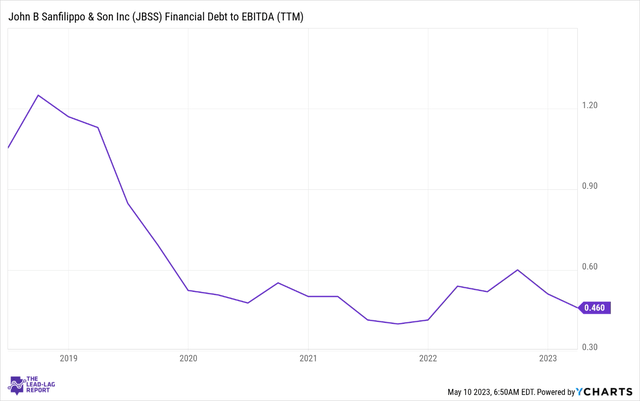
JBSS isn’t just blessed with a declining leverage profile, the company has also done well to reorient its asset mix, so much so that the free cash flow (“FCF”) generated from these assets is currently at the high-teens level. Inevitably, this has also boosted the FCF yield associated with JBSS, which currently stands at 6.3%, well over the long-term average.
YCharts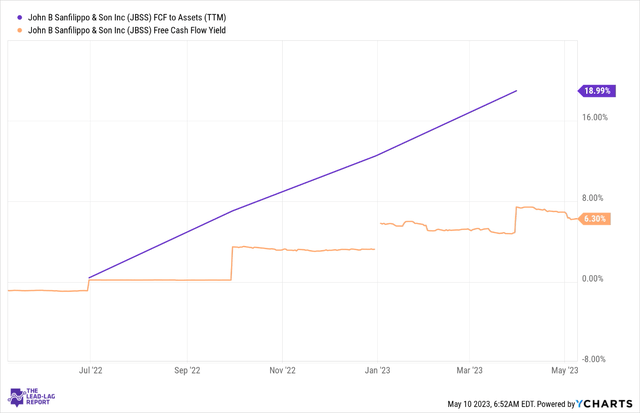
A declining leverage profile combined with improving FCF should typically result in a firm being more generous with its distribution. In fact, towards the end of April, I had flagged that this would be a dominant theme in the consumer staples sector.
Twitter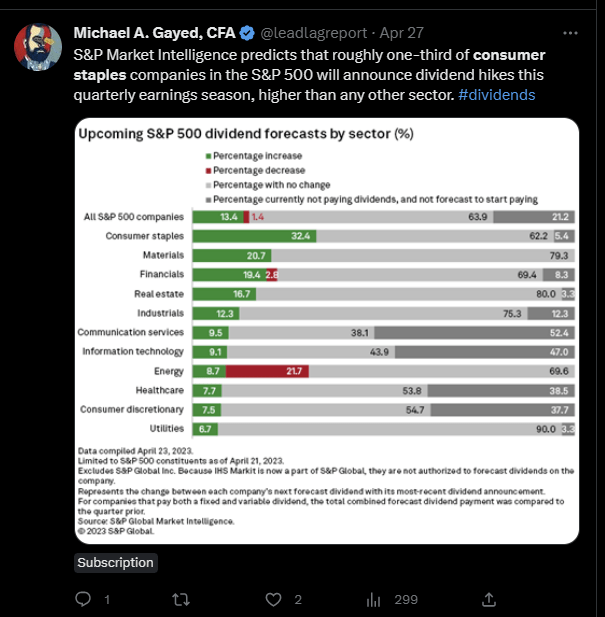
Well, you’d be interested to know that JBSS has a fairly consistent history of sharing its largesse with its shareholders. Since FY17, it has also become more active in distributing special dividends. Earlier this month, we saw JBSS turn constructive once again, distributing a special dividend of $1.5 per share (in cash flow terms, this would cost the company around $17m).
Twitter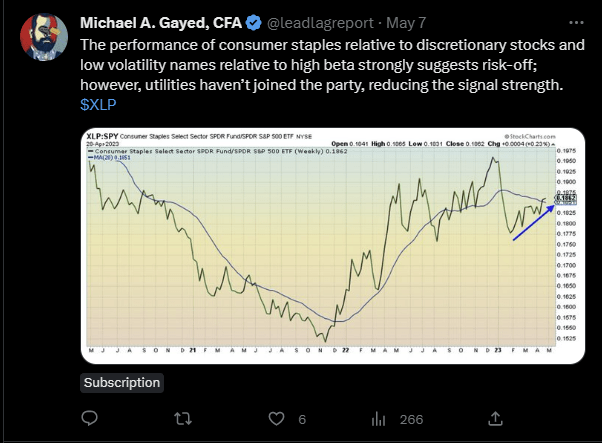
It’s also worth noting that staple stocks like JBSS typically tend to attract defense-seeking investors, particularly during periods of heightened market volatility. As flagged in The Lead-Lag Report, this sector is in a good way, and it should reflect well on JBSS. What also works in JBSS’s favor is that its sensitivity to the benchmark has dimmed compared to what it was 4-5 years back.
YCharts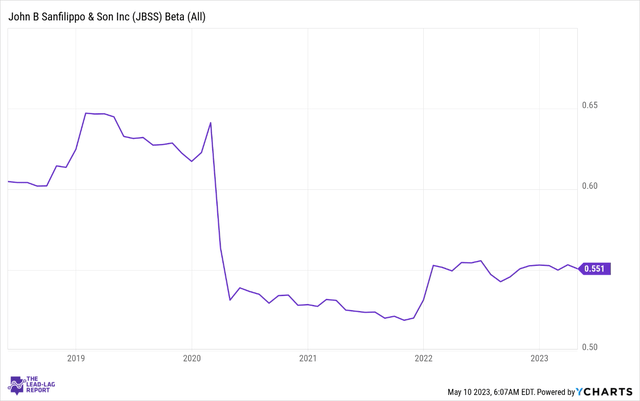
To get a sense of these defensive qualities, one may also consider looking at a chart measuring the strength of JBSS against the S&P 600 Small-Cap Index; we can see that during early 2020, a lot of small-cap chasing investors rotated towards JBSS, sending the relative strength ratio to record highs. Similar trends are playing out currently, with the relative strength ratio demonstrating solid strength in recent months, and not too far from lifetime highs.
StockCharts.com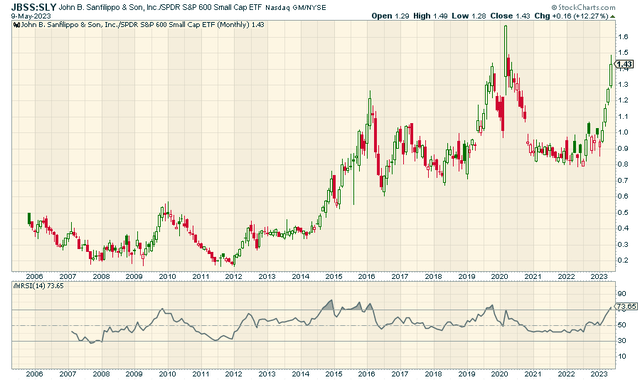
Conclusion
Given some of John B. Sanfilippo & Son, Inc.’s useful qualities, you would think it would attract plenty of positive attention from various market participants, particularly during wobbly times like these when just 30% of the broader markets are currently trading above their 200DMAs.
Twitter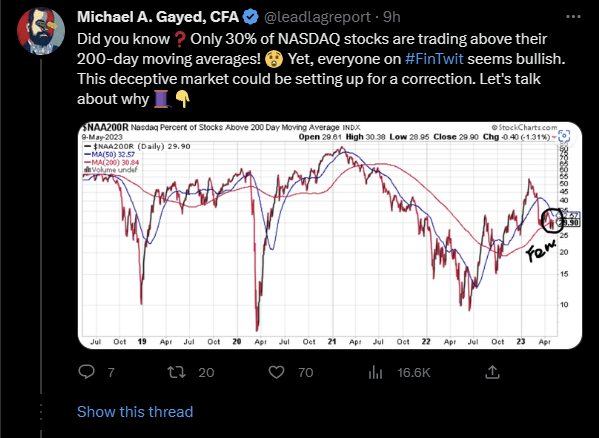
Indeed, the chart below highlights how investors have recently rushed to JBSS, sending it to lifetime highs. However, readers should also be mindful of the fact that the 14-period RSI has now reached a point from where we previously saw quite a drastic correction in the stock price.
StockCharts.com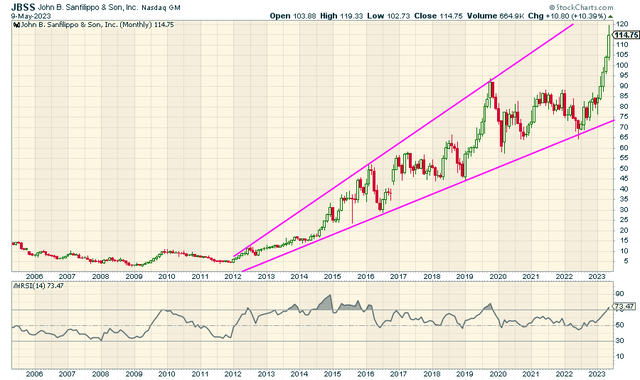
It also doesn’t help that on a YTD basis, we’ve already witnessed a 25% expansion in John B. Sanfilippo & Son, Inc.’s P/E multiple, so much so that it currently trades at 20.35x, higher than the stock’s historical average multiple of 19.5x.
Read the full article here
