")
Written by Nick Ackerman, co-produced by Stanford Chemist. This article was originally published to members of the CEF/ETF Income Laboratory on May 7th, 2023.
Cohen and Steers is the top-tier fund sponsor for closed-end fund real estate investing, and the results of their funds show this. One of their more popular funds is the Cohen & Steers Quality Income Realty Fund (NYSE:RQI). However, there is also a non-leveraged fund that is largely similar. That is the Cohen & Steers Total Return Realty Fund (NYSE:RFI).
We know that REITs were hit hard more recently with rapidly rising interest rates. Therefore, an investor that might be tempted to invest in the real estate space might still be pretty cautious, given the uncertainty going forward. The Fed is expected to pause further rate hikes from here, but that doesn’t mean they couldn’t resume raising should data warrant it. That’s why a more risk-averse investor could consider RFI over RQI. RQI is still quite an attractive fund for longer-term, more aggressive investors.
RQI Basics
- 1-Year Z-score: -1.66
- Discount: -7.18%
- Distribution Yield: 8.35%
- Expense Ratio: 1.33%
- Leverage: 29.92%
- Managed Assets: $2.37 billion
- Structure: Perpetual
RQI’s investment objective is to provide a “high current income.” They also have a secondary investment objective of “capital appreciation.” They will invest in “real estate securities including common stocks, preferred stocks and other equity securities of any market capitalization issued by real estate companies, including real estate investment trusts (REITs) and similar REIT-like entities.”
RFI Basics
- 1-Year Z-score: -1.18
- Premium: 1.03%
- Distribution Yield: 8.15%
- Expense Ratio: 0.89%
- Leverage: N/A
- Managed Assets: $308.89 million
- Structure: Perpetual
RFI’s Investment objective is “to achieve a high total return.” They’ll attempt to achieve this “through investment in real estate securities. Real estate securities include common stocks, preferred stocks and other equity securities of any market capitalization issued by real estate companies, including real estate investment ruts (REITs) and similar REIT-like entities.”
One point that might be interesting to note is that RFI is the older of the two funds. It was launched in 1993, while RQI was launched in 2002.
Leverage And Expenses
Right away, we can see that the investment policy to achieve each respective objective for the funds is identical. However, we can see that RQI is also significantly larger than RFI and that RQI is leveraged vs. no leverage for RFI. This plays a role in the size of the fund, but even if RQI weren’t leveraged, it would still be significantly larger.
At the same time, that hasn’t helped reduce RQI’s expense ratio compared to RFI’s. The expense ratio of 1.33% doesn’t include the leverage expenses, which would take the total expense ratio up to 1.72%.
RQI’s expenses were higher than in 2021 as well when total expenses came in at 1.91%. This happened because not only were rates rising on their borrowing costs, but they also increased their total outstanding borrowings from $672.5 million to $710 million.
Fortunately, RQI’s management had done a good job in managing their leverage heading into the rising rate environment. They had locked in most of their leverage in fixed rates via mostly interest-rate swaps. For this reason, the weighted average cost of financing has remained at 2.7%, while other unhedged CEFs are seeing borrowing costs of 5 to 6%. The weighted average term on the fixed financing is 3.37 years, meaning we have a few years before we have to start worrying about those types of costs.
RQI Leverage Facts (Cohen & Steers)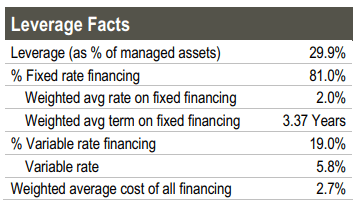
So while RQI’s leverage costs have risen due to higher rates, this is being offset by gains made up in their swaps. For 2022, that worked out to realizing gains of over $2.7 million from swaps and seeing over $51 million in unrealized gains.
RQI Realized/Unrealized Gains/Losses (Cohen & Steers)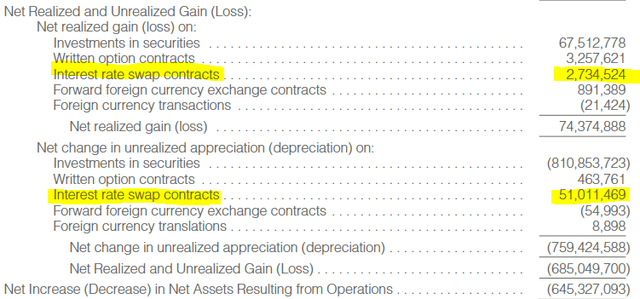
In the last fiscal year, the interest expenses were $19.946 million compared to $13.146 million in 2021. Meaning that the interest rate swaps did more than their share of offsetting these rising expenses. Of course, it wasn’t nearly enough to stem the losses in the underlying portfolio, but had it not been for these swaps, losses would have been worse.
While RFI didn’t have these interest rate swaps in place, as it wasn’t really necessary to hedge, it is worth noting that they also collected and saw some realized gains from options premiums. These options premiums came through writing calls on their underlying positions. That’s another small way that the funds can offset some losses and work best in a slightly down or flat year.
All this being said, with leverage expenses, RQI’s expense ratio is naturally going to be higher relative to RFI. In addition to that, RQI’s management fee is 0.85%, while RFI’s management fee is 0.70%. That will mean RFI’s expense ratio will always be lower as well, even if RQI is deleveraged.
Volatility, Discount/Premium and Performance
The added leverage can make a fund much more volatile, so we should see RFI as relatively more stable. That’s mostly true, as RFI experienced lower volatility in the last year compared to RQI.
YCharts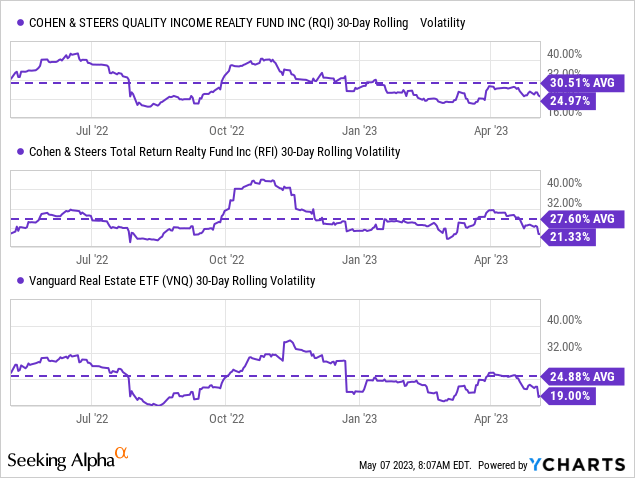
Both funds experienced greater volatility in the last year when compared to Vanguard Real Estate ETF (VNQ). This is due to RQI and RFI having material discounts/premiums that they have to contend with. That overall makes CEFs more volatile than comparable ETFs, even if they aren’t leveraged CEFs.
This brings up the point that RFI continues to trade at a richer valuation compared to RQI. Over the longer term, RQI is trading right at its average discount in the last decade. RFI is trading slightly above its decade average at a slight premium when it has averaged a slight discount in this time. That’s despite the overall volatility in the REIT space.
We often see discounts expand when there is more volatility, so it makes sense that these funds have given up the higher valuations they were able to cling to for the last several years – and going back to their longer-term average at this time.
YCharts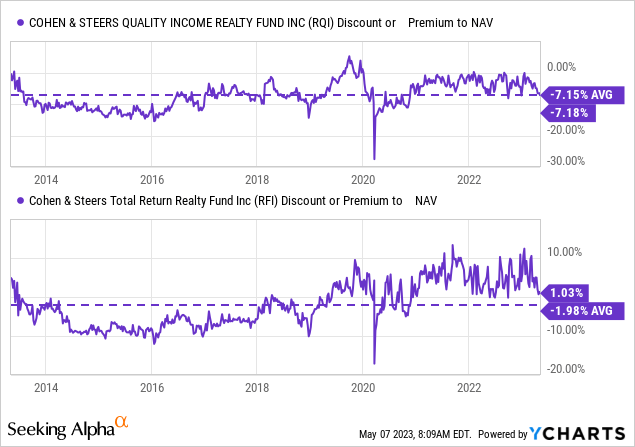
I think this helps represent that while either fund can certainly go to a deeper discount, both are at attractive and reasonable valuations. These valuations are in addition to what I believe are overly depressed REIT valuations.
In looking at the performance over the long term, one would suspect that RQI has outperformed, given its leverage. And that suspicion would be correct. Over the last decade, RQI has outperformed both RFI and VNQ. That’s both on a total NAV and total share price return basis.
YCharts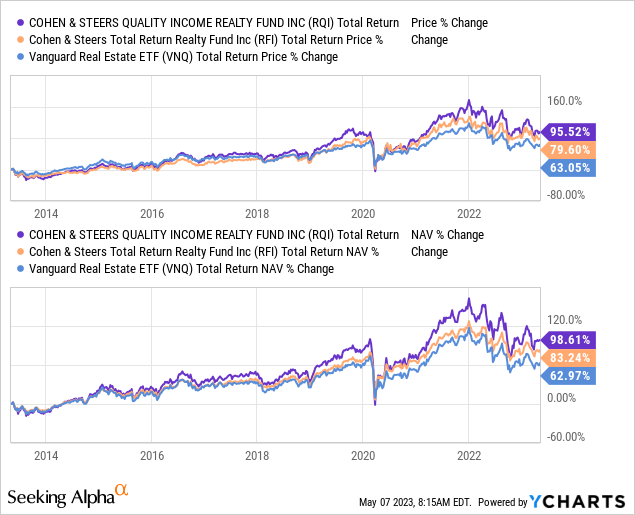
In the shorter term, with much more volatility in the space and pressure on all of these funds, we would expect the reverse to be true. That would be seeing RFI leading the way with reduced losses. One might also suspect that VNQ would easily be able to beat RQI, too, since VNQ also isn’t leveraged.
Well, in this case, that didn’t entirely play out. Instead, we see that RFI did see reduced losses. However, RQI was able to buck the lower results of VNQ despite being leveraged on a total NAV return basis. On a total share price basis, RQI actually came out on top of all three but just barely edged out RFI.
YCharts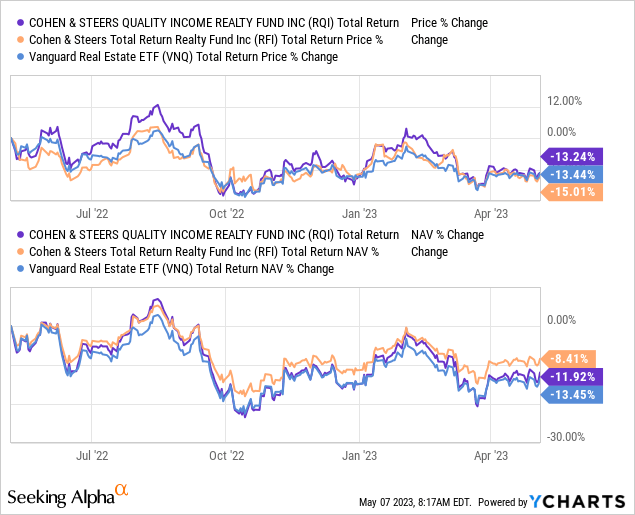
Distributions, Attractive Rates, But Need Gains
Both funds are heavily invested in the commons of equity REITs. As we know, those have been pressured in the last year or so due to rising rates – we highlighted the negative results just above. We also know that distribution rates of 8.35% for RQI and RFI’s 8.15% are coming from sources other than income alone. VNQ pays a 4.12% yield and has an expense ratio of just 0.12%.
So that means that both RQI and RFI are pulling in capital gains and/or return of capital to fund their distributions. That’s where those gains from derivatives can come in handy to help support a higher distribution yield, even when underlying gains in their portfolios are harder to come by. Worth noting is that RQI saw its net investment income rise year-over-year.
RQI Annual Report (Cohen & Steers)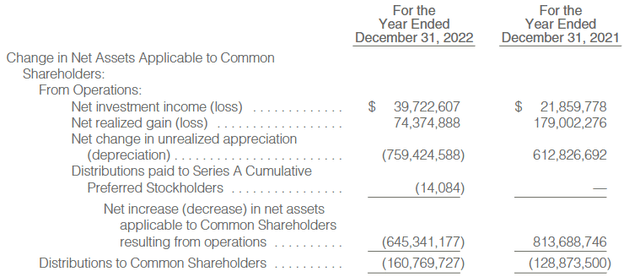
RFI saw a similar trend, with a big boost in its NII year-over-year. That means that while capital gains will still make up the bulk of the distributions, this growing income can help ease some of the pressure.
RFI Annual Report (Cohen & Steers)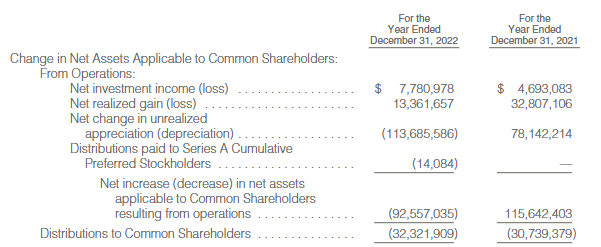
Still, despite what was a rough period so far, neither fund seems to be at a point where their payouts need to be cut. RQI’s NAV rate comes to a manageable 7.75%. RFI’s payout is higher at 8.23%, but I wouldn’t necessarily say that it is at a red flag level yet. If we get a recovery in REITs over the next year or two, that will also ease the pressure. However, the opposite is also true in this case; if the REIT space continues to grind lower, it will be more difficult to manage the payouts at current levels.
We aren’t at the place where both funds ended up cutting their payouts in 2008/09 due to the GFC. For years afterward, they switched to quarterly distributions to help recover their asset base. They had both returned to paying out monthly at a similar time in 2016.
Portfolio Comparison
At the broader level, RQI listed that 79% of its portfolio was held in common stock, with 21% in preferred and fixed income at the end of March 2023. In that respect, RFI’s breakdown was exactly identical at a 79%/21% split. There has to be some deviation, though, between these funds. The reason is that RQI listed 201 holdings while RFI at 182. So there are at least 19 different holdings between the funds.
We do see a bit of divergence appear when looking at the sector breakdown of each fund. RQI puts 12% of its portfolio in corporate bonds compared to 11% for RFI. Industrials are 11% for RQI, and that is RFI’s largest weighting at 12%.
Sector Allocation (Cohen & Steers)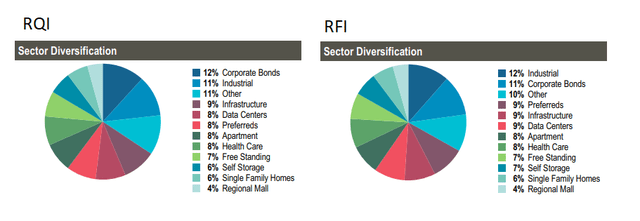
Of course, that’s only a marginal difference – as is the 11% of “other” in RQI compared to the 10% listed for RFI. Preferreds make up 8% of RQI and 9% of RFI. Data centers make up 8% of RQI and 9% of RFI. The only other difference then is in self-storage, with RQI at 6% and RFI at 7%. From there, the weightings are listed as competently identical for apartments, healthcare, free-standing, single-family homes, and regional malls exposure.
Naturally, with such insignificant weighting differences in their sector diversification, this also is mirrored in the top holdings. Every single top holding is the same, with only minor differences between the actual weightings that set them apart.
Top Ten Holdings (Cohen & Steers)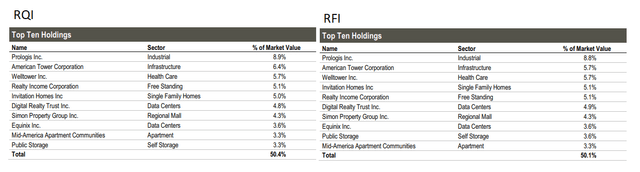
Worth pointing out is that both funds carry oversized allocations to the top ten holdings, with both representing over 50% of each entire portfolio. That’s meaningful, considering that each fund’s success or failure will depend more on the top ten than the rest of the portfolio.
Conclusion
If you are bullish on REITs over the long term, RQI still makes the most sense, given the discount and opportunity that leverage can work in your favor. If you are a more risk-averse investor but still want C&S active management for your REIT exposure, then RFI can be a perfectly fine choice. At a slight premium, it isn’t at any sort of gross overvaluation. That’s especially true if you believe that REIT valuations are looking tempting after their tumble due to higher rates.
Read the full article here