A guest post by Ovi
All of the Crude plus Condensate (C + C) production data for the US state charts comes from the EIAʼs Petroleum Supply monthly PSM which provides updated information up to Febuary 2024.
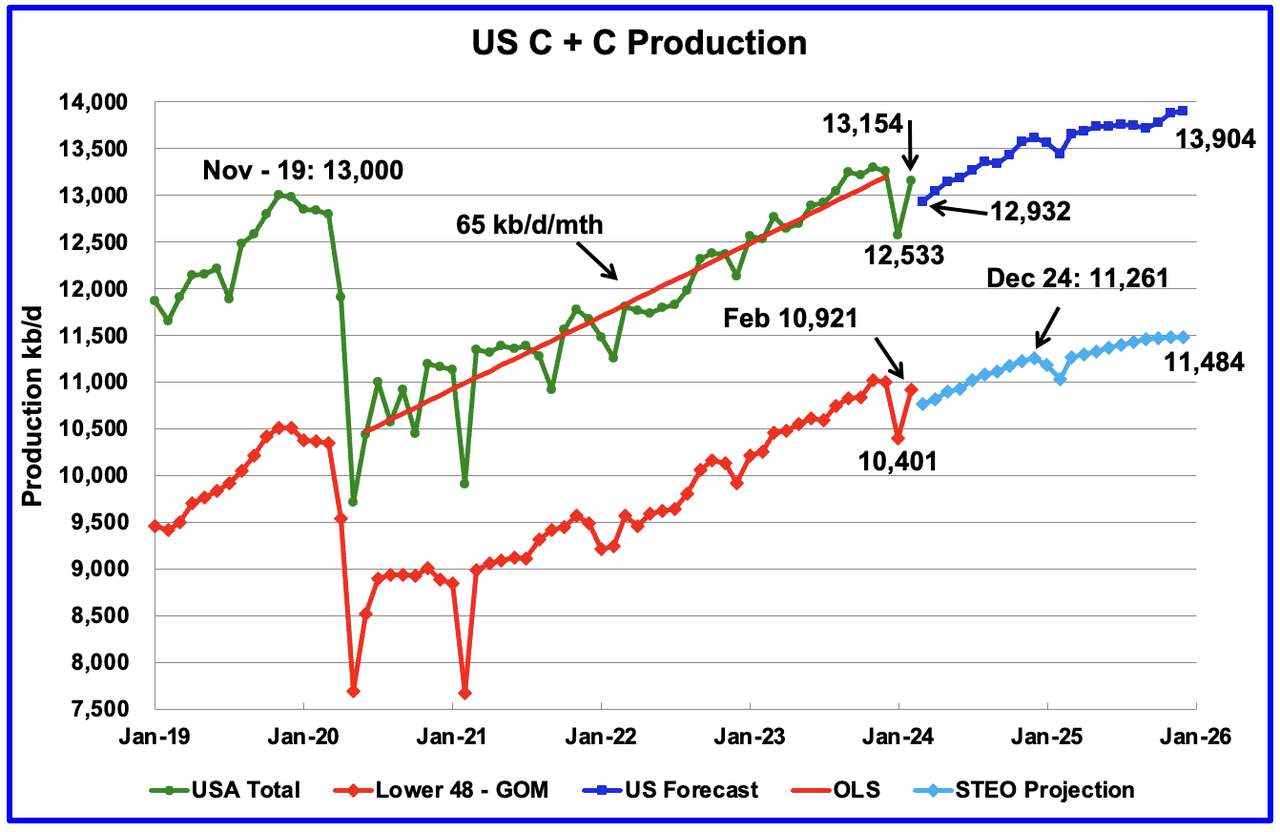
U.S. February oil production rebounded by 578 kb/d to 13,154 kb/d. The large increase was due to a rebound from the severe January winter storm that spread across most central states. The largest increases came from Texas, 172 kb/d and North Dakota 173 kb/d.
The dark blue graph, taken from the April 2023 STEO, is the forecast for U.S. oil production from March 2024 to December 2025. Output for December 2025 is expected to reach 13,904 kb/d and is an increase of 82 kb/d from the previous STEO report.
The red OLS line from June 2020 to December 2023 indicates a monthly production growth rate of 65 kb/d/mth or 780 kb/d/yr. From February 2024 to December 2025 production is expected to grow by 750 kb/d. This increase is very high growth and is not consistent with many articles predicting a near term peak in US oil production.
The light blue graph is the STEO’s projection for output to December 2025 for the Onshore L48. From February 2023 to December 2025, production is expected to increase by 563 kb/d to 11,484 kb/d which is 103 kb/d higher than reported in the previous STEO.
Is the slow rollover in production shown in the last four months of 2025 in the Onshore L48 pointing to peak US production occurring in late 2025?
January 2024 World Oil Production
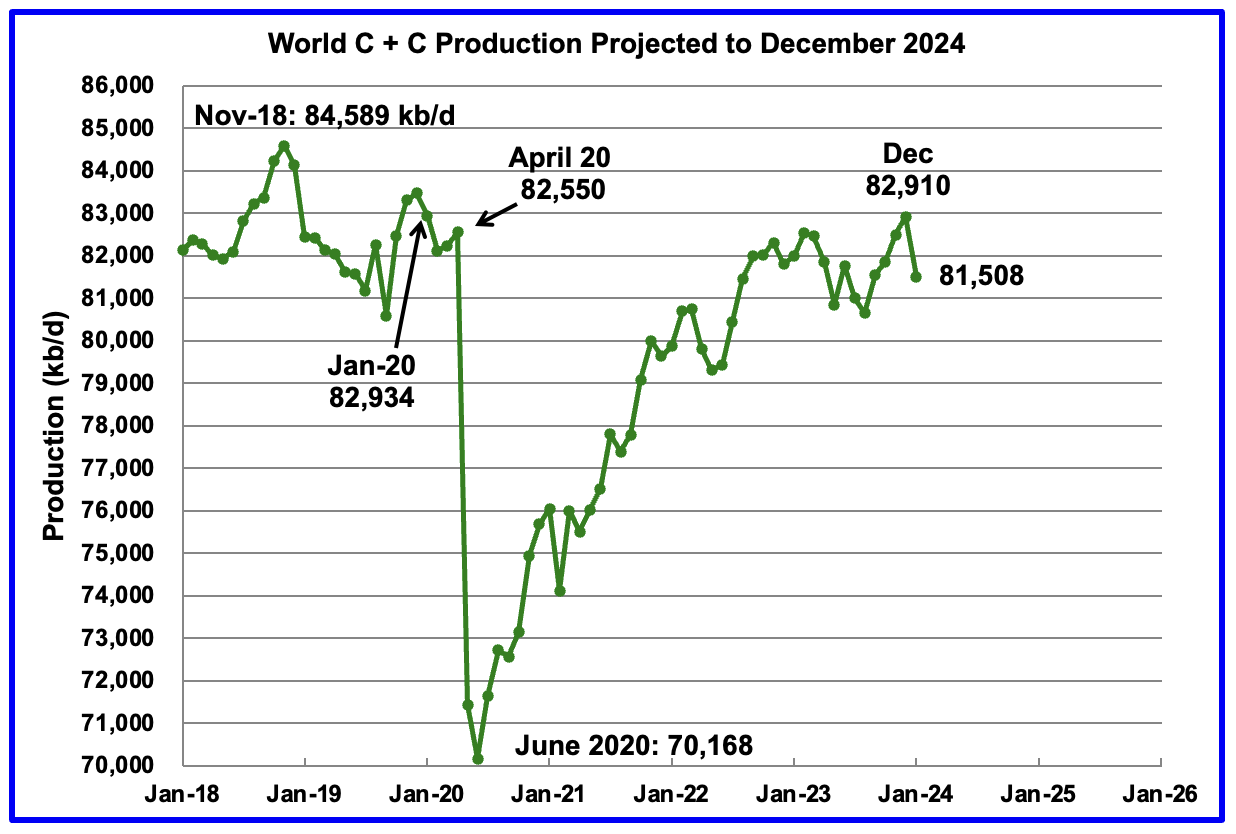
World oil production for January 2024 was released today. Production dropped by 1,402 kb/d, of which 762 kb/d came from the U.S. More on World oil production next week.
US Oil Production Ranked by State
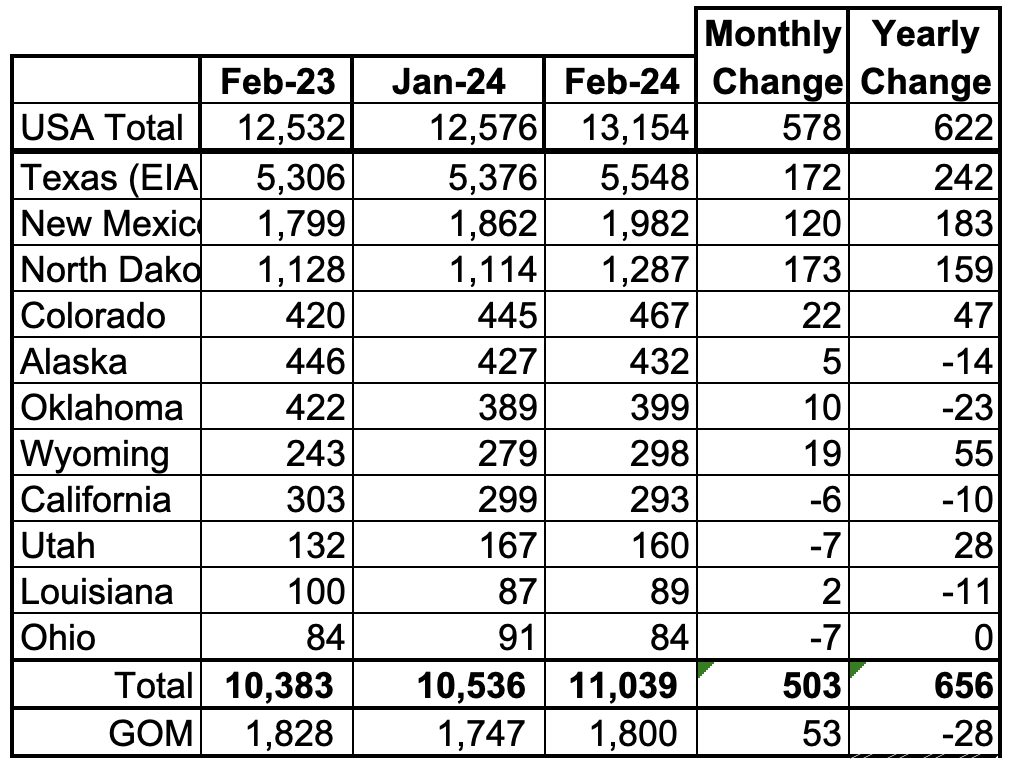
Listed above are the 11 US states with the largest oil production along with the Gulf of Mexico. Ohio has been added to this table since its production approached 100 kb/d in January and exceeded Louisiana’s production. These 11 states accounted for 83.9% of all U.S. oil production out of a total production of 13,154 kb/d in February 2024.
On a YoY basis, US production increased by 622 kb/d. GOM production rose by 53 kb/d MoM while YOY it is down by 28 kb/d.
State Oil Production Charts
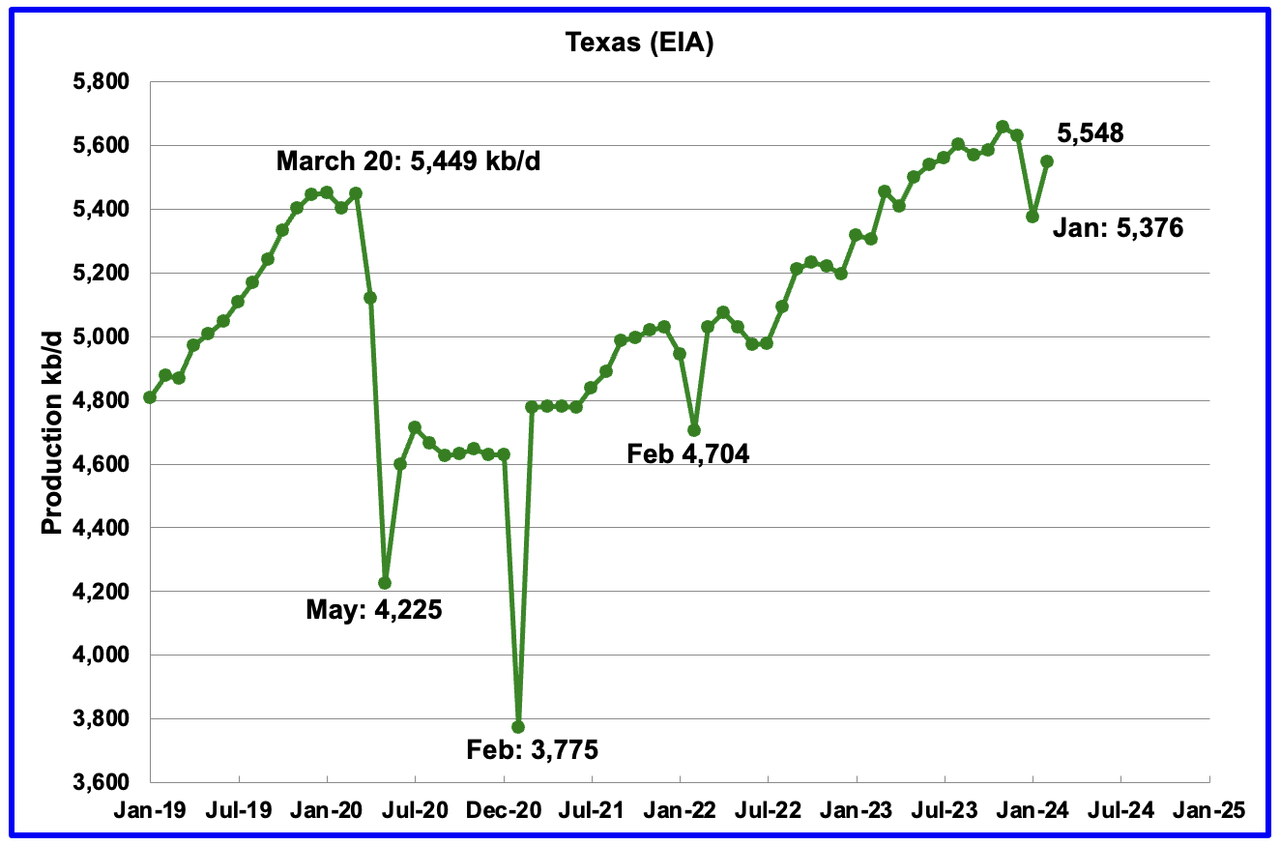
Texas production increased by 172 kb/d in February to 5,548 kb/d.
It is interesting to note that February’s daily production increase of 172 kb/d was smaller than January’s drop of 255 kb/d. Could this be related to the lack of drilling or completions during those 10 freezing days in January while the rapid decline in LTO producing wells continued and is difficult to make up?
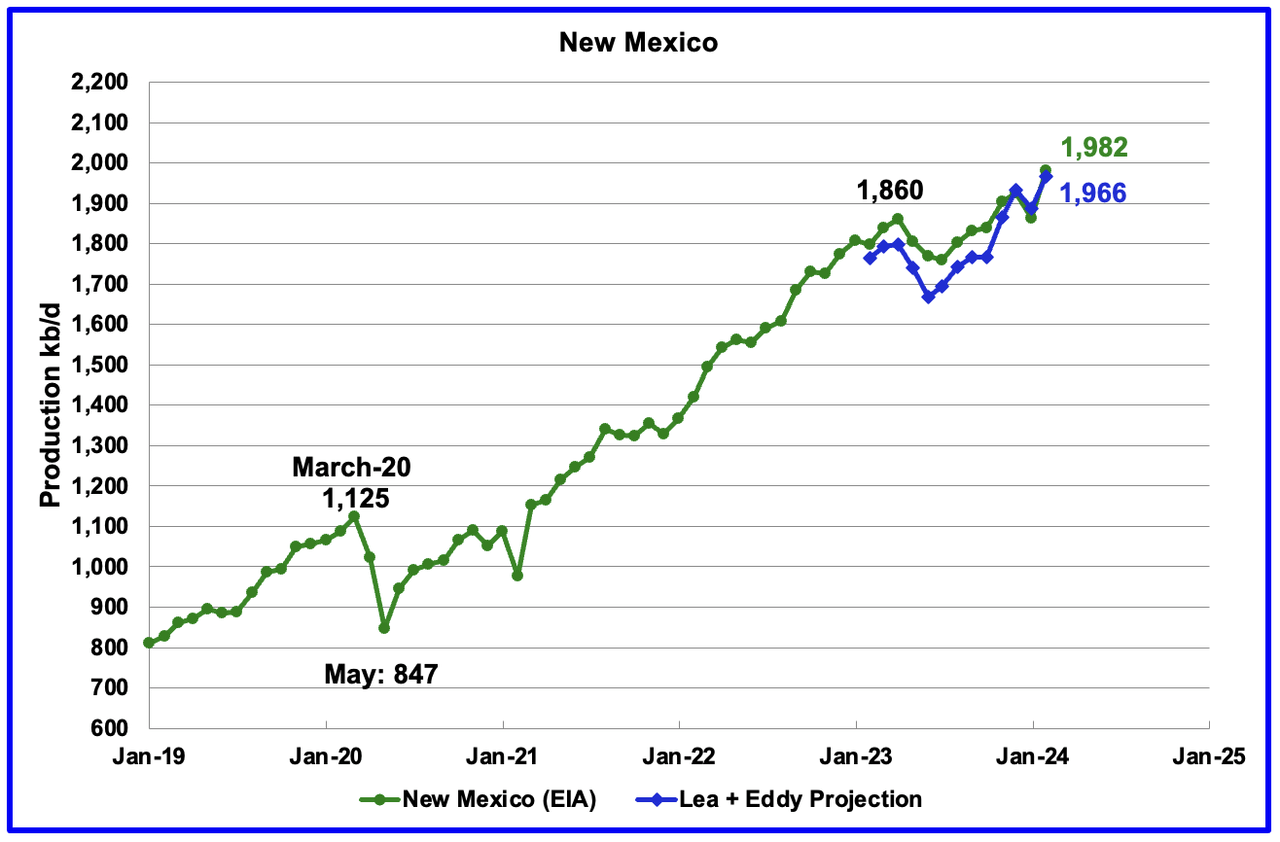
New Mexico’s February production rose by 120 kb/d to a record high 1,982 kb/d.
The blue graph is a production projection for Lea plus Eddy counties since these two counties account for the majority of New Mexico’s oil production. The projection used the difference between February and January preliminary production data provided by the New Mexico Oil Conservation Division. The projection provides a reasonable estimate for New Mexico’s production.
The combined projected output from Lea and Eddy counties in February increased by 79 kb/d to 1,966 kb/d vs the 120 kb/d reported by the EIA.
More oil production information from these two counties is reviewed in the special Permian section further down.
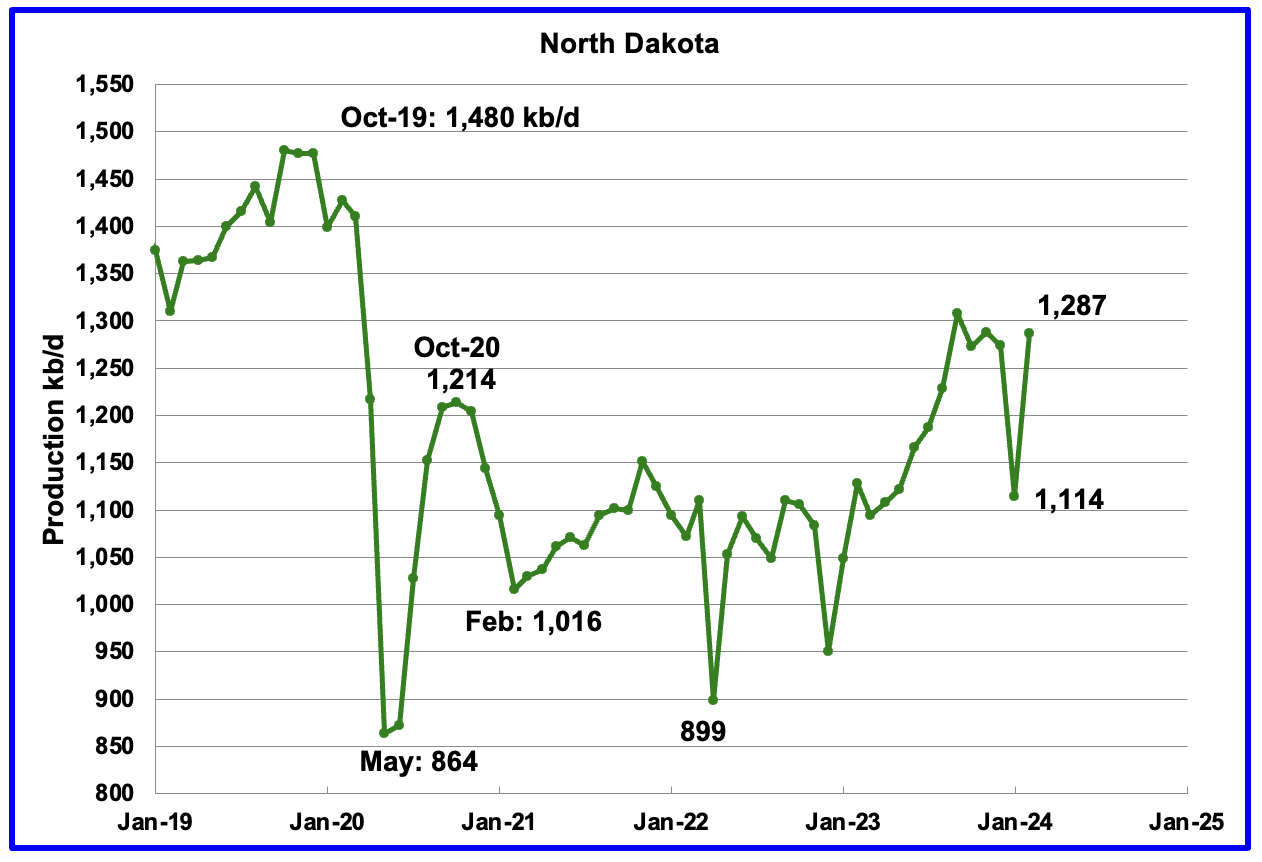
February’s output rose by 173 kb/d to 1,287 kb/d. YoY production increased by 159 kb/d.
According to this article, North Dakota’s February production was 1,250 kb/d. Seems the EIA found an extra 37 kb/d.
“According to the Department’s Director, Lynn Helms, the state produced 1.25 million barrels of oil a day in February — a 13% percent increase from January.
“Along with that, gas production jumped to 3.36 billion cubic feet a day… a 12 percent increase in natural gas production,” said Helms.
As for as rig count numbers, Helms reported that they were at 38 in February, but, jumped to 40 in March.”
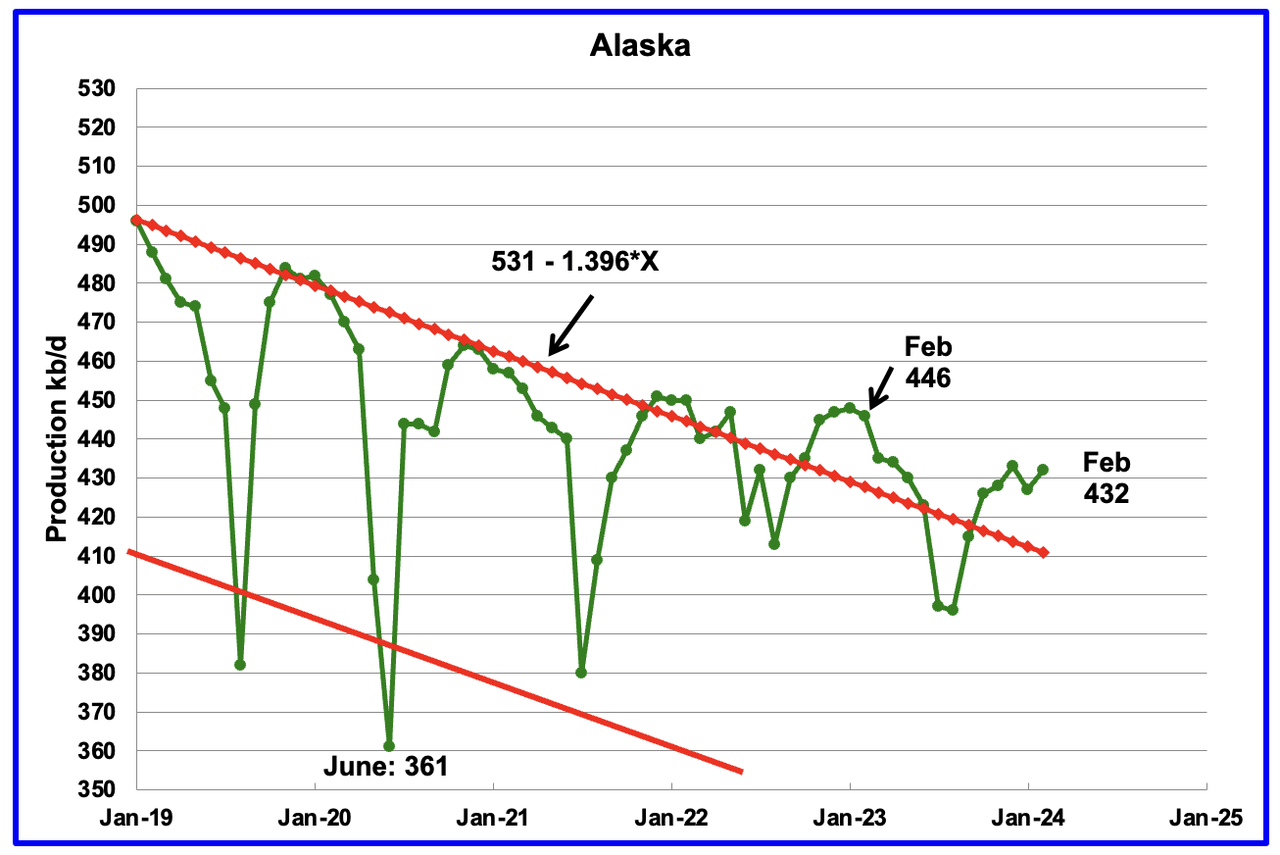
Alaskaʼs February output rose by 5 kb/d to 432 kb/d. Production YoY is down by 14 kb/d. The EIA’s weekly petroleum report continues to show Alaska’s April oil production is in the 430 ±5 kb/d range.
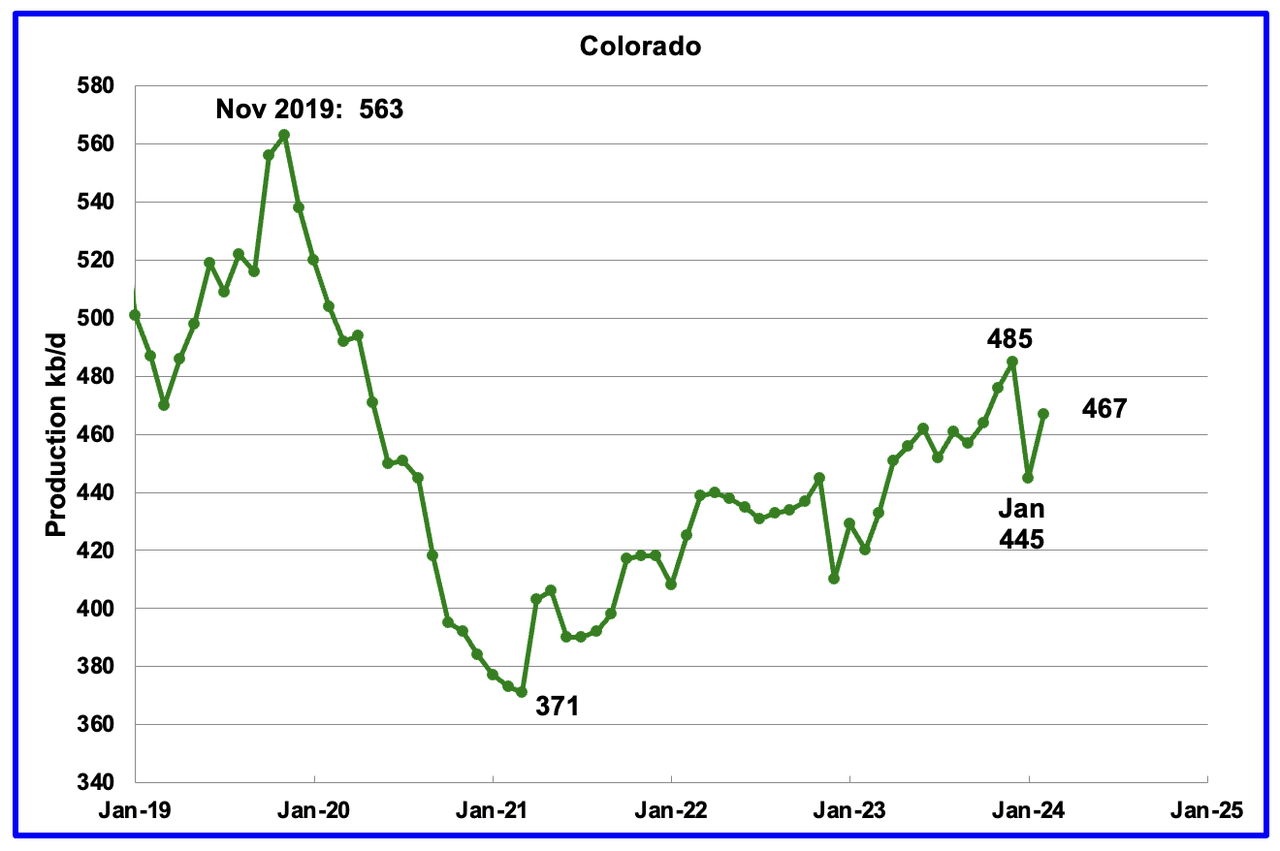
Coloradoʼs February production increased by 22 kb/d to 467 kb/d. Colorado has moved ahead of Alaska to become the 4th largest US oil producing state. Colorado began the year with 12 rigs but has now dropped to 9 in early May.
According to this article, Colorado oil producers will have to pay an oil production fee as part of an agreement with environmental groups.
“Colorado’s oil producers are bracing for a new fee associated with their production as part of a compromise the industry reached with environmental groups that were pushing for more stringent regulations on drilling.
Colorado, the fourth-largest oil producing state in the U.S., is a frequent battleground for the oil industry and environmentalists, who over the years have pushed for tougher regulations on fossil fuel production.
The deal reached this week will eliminate several proposed ballot measures targeting the fossil fuel industry ahead of this year’s election, including one that would have halted drilling in summer months.
As part of the compromise, producers will get hit with a fee that fluctuates with market prices on every barrel of oil produced in the state.
“We’re not huge fans of the fee dynamic / structure,” said analysts for investment firm Tudor, Pickering, Holt & Co in a note, adding it is estimated to generate some $140 million in revenue.”
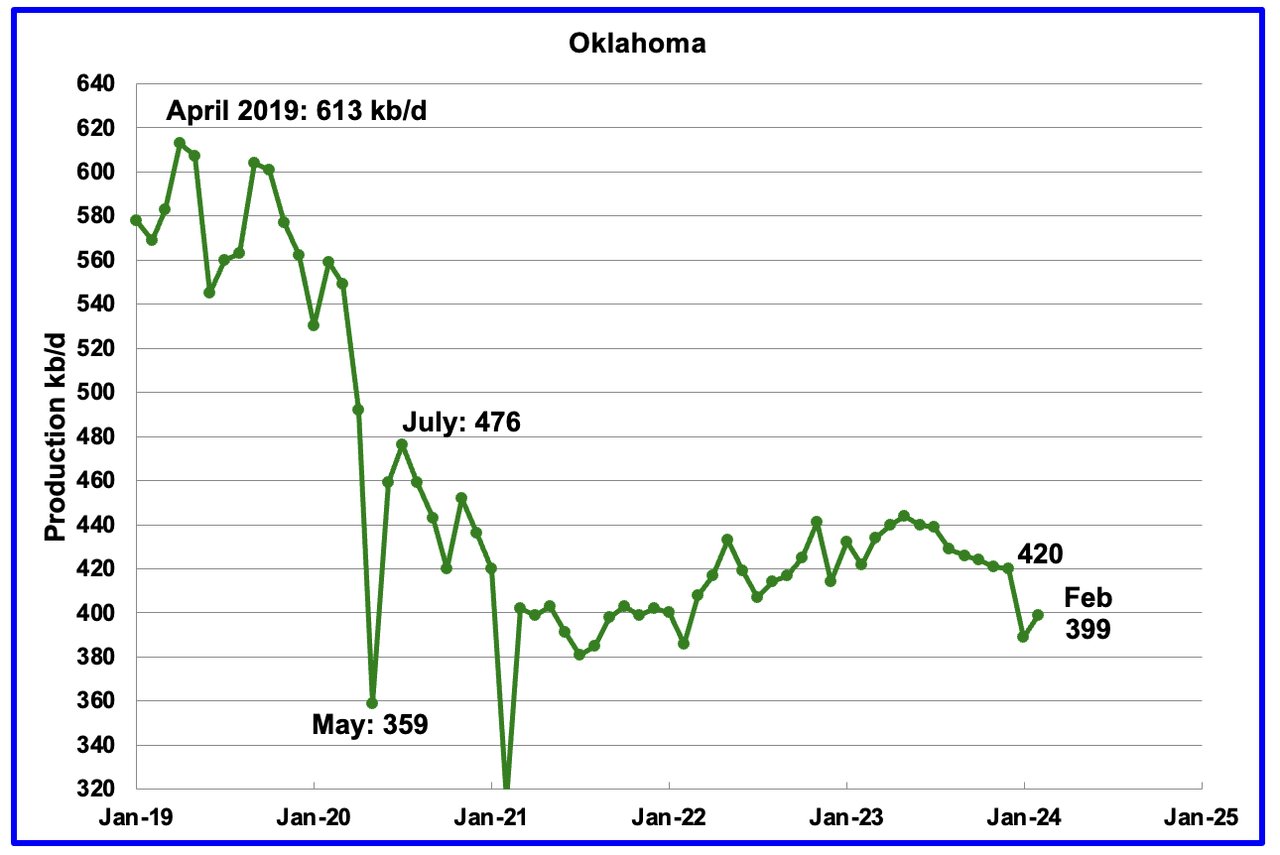
Oklahoma’s output in February rose by 10 kb/d to 399 kb/d. Production remains below the post pandemic July 2020 high of 476 kb/d. Output appears to have entered a slow declining phase. Note that January production dropped by 31 kb/d while February only rose 10 kb/d.
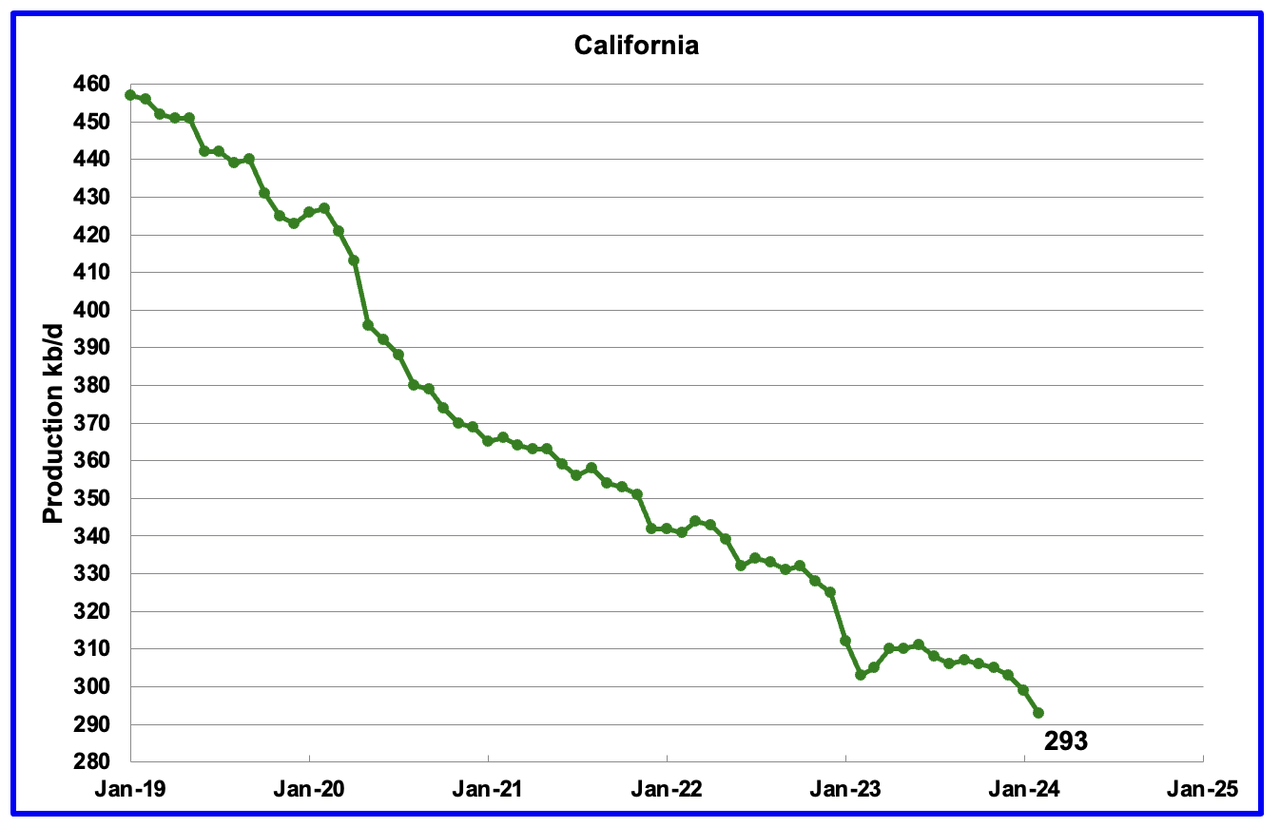
Californiaʼs February production continued its slow decline by dropping 6 kb/d to 293 kb/d. Production on average appears to be dropping at the rate of 2 kb/d/mth. From February 2021 to February 2024, production has dropped by 73 kb/d or close to 2 kb/d/mth.
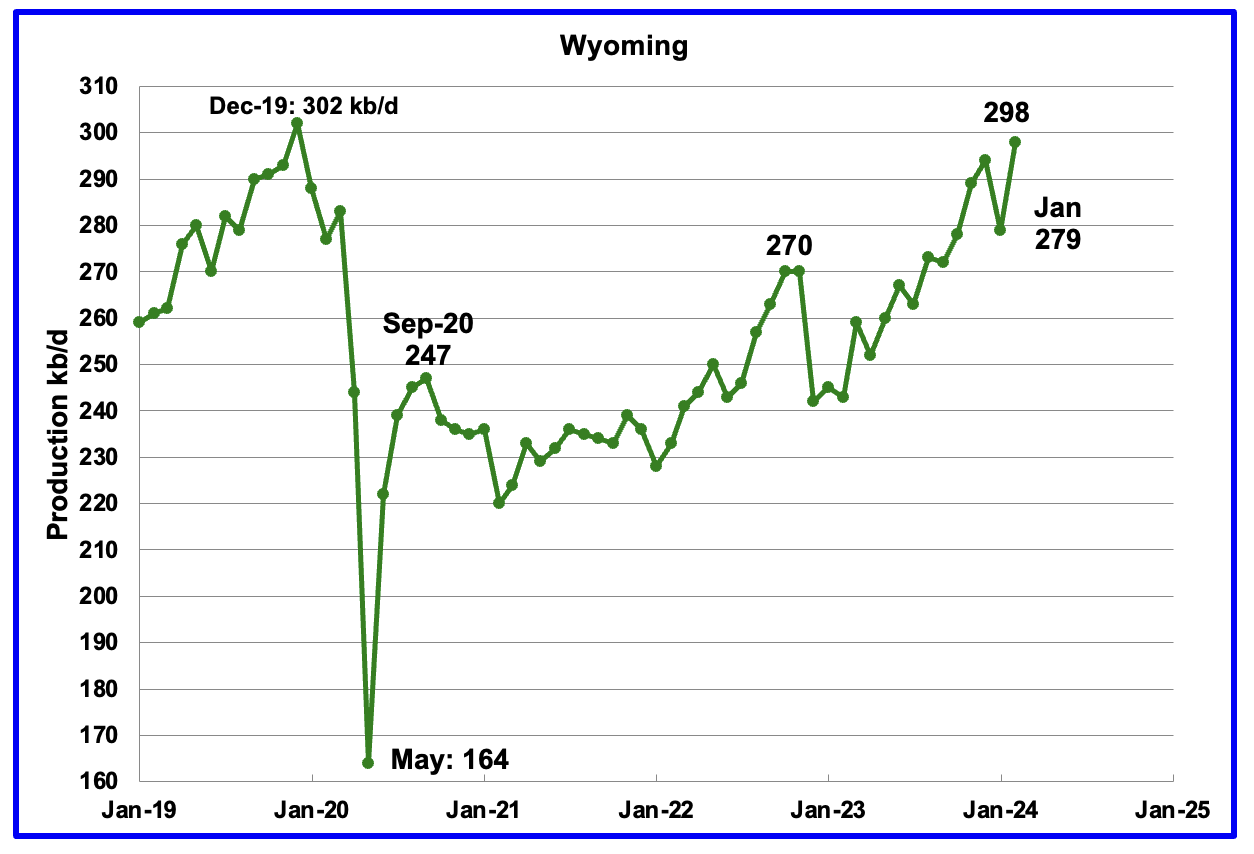
Wyoming’s oil production has been rebounding since March 2023. However the rebound was impacted by the January 2023 storm. February’s oil production recovered from January’s drop by 19 kb/d to a new post pandemic high of 298 kb/d.
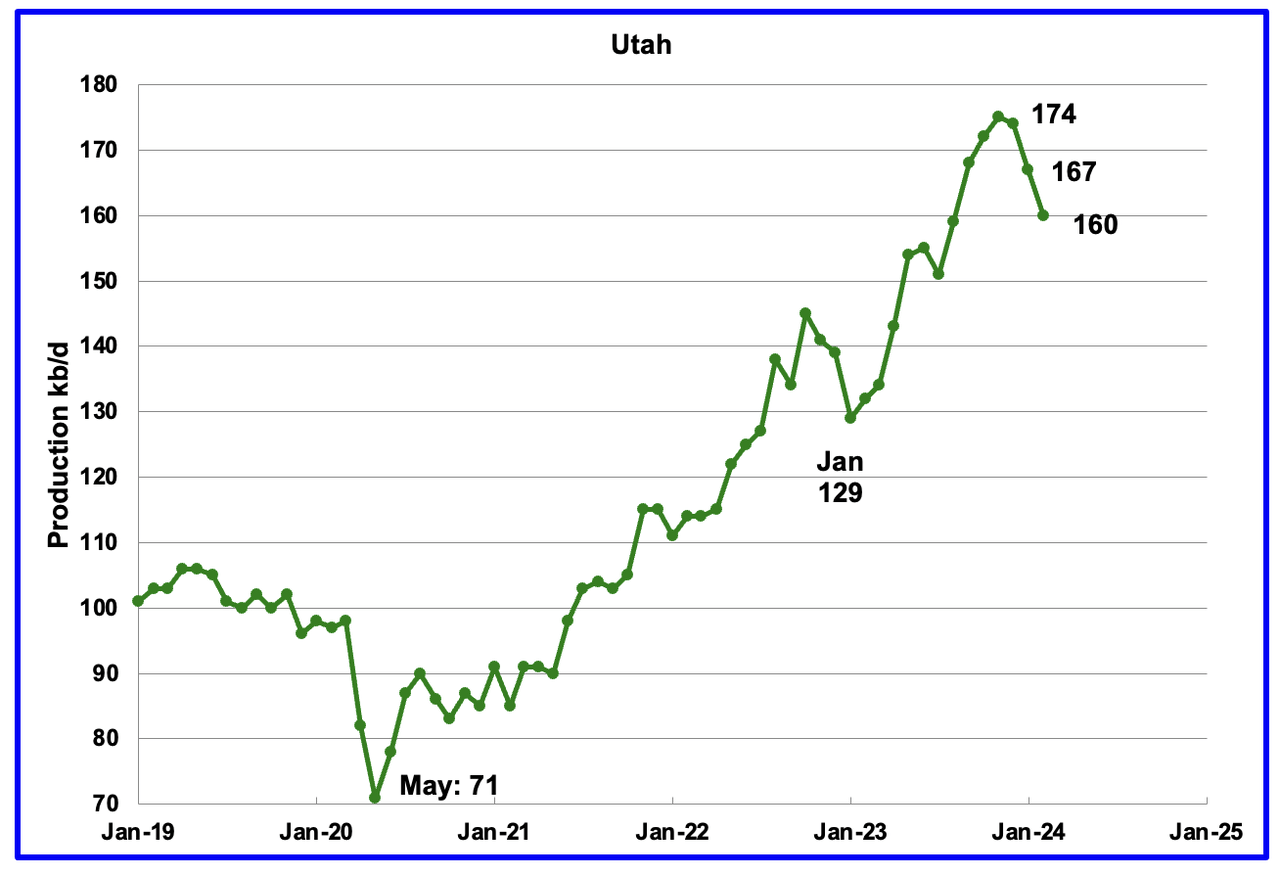
February’s production decreased by 7 kb/d to 160 kb/d. For the first 4 months of 2024, Utah has had 9 oil rigs in operation. It is not clear why production is dropping.
According to this article, one producer is using more proppant to increase production.
“Crescent Energy is doubling down on proppant in the Uinta Basin, making 50% bigger wells for 35% fewer bucks per boe of output, the company reported March 5.
“When we acquired this position [in 2022], the only horizontal development on the assets utilized a legacy, smaller completion design with roughly 1,500 pounds of proppant per foot,” David Rockecharlie, Crescent CEO, said in an earnings call.
New completions use 3,000 lbs per foot. “The early results from our updated design, which we implemented over the last nine months, are significantly better than the previous design.”
The increased production since February 2023 has come from the Uinta basin.
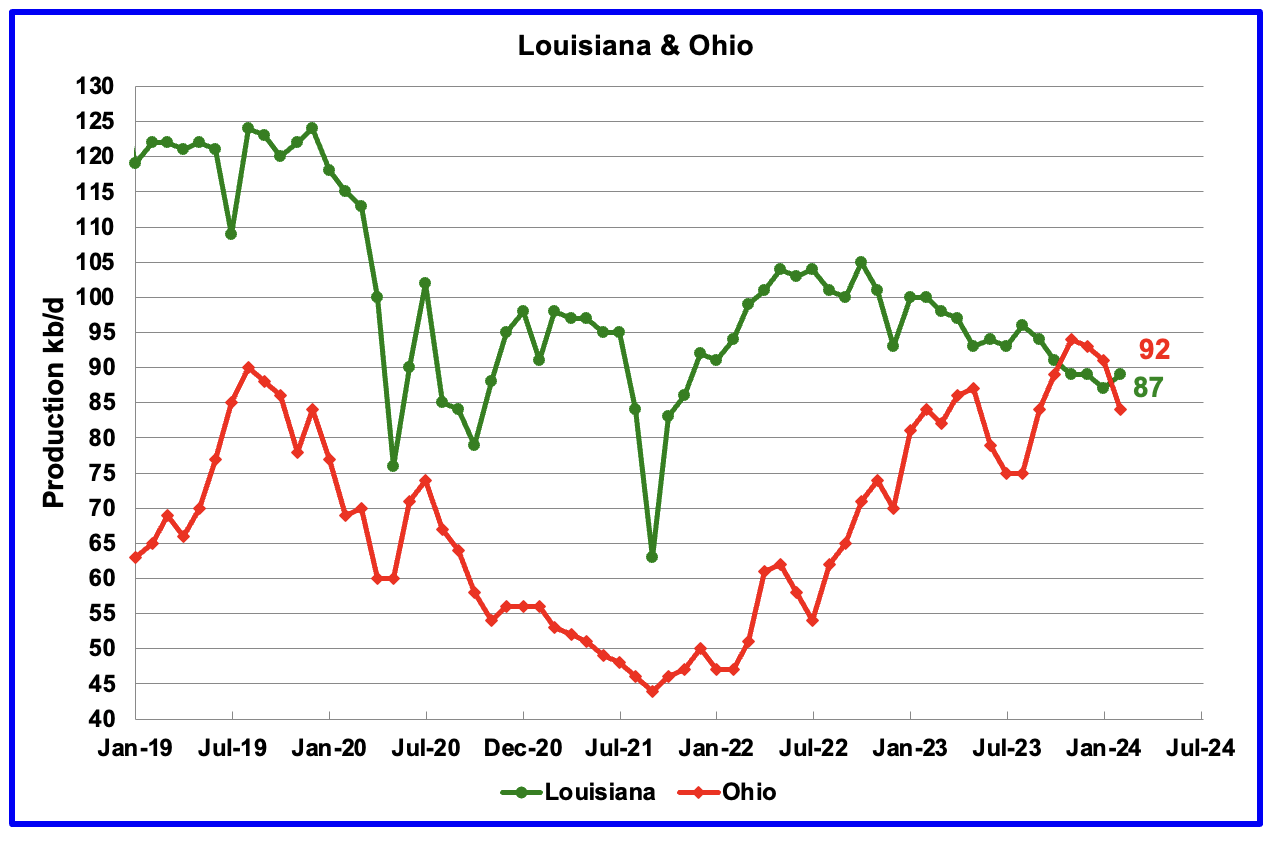
Ohio has been added to the Louisiana chart because Ohio’s production has been slowly increasing since October 2021 and passed Louisiana in November 2023.
Louisiana’s output entered a slow decline phase in October 2022. February’s production decreased by 2 kb/d to 87 kb/d. Ohio’s oil production dropped by 7 kb/d to 84 kb/d after reaching a post pandemic high of 94 kb/d in November. The most recent Baker Hughes rig report now shows two horizontal oil rigs operating in Ohio in April.
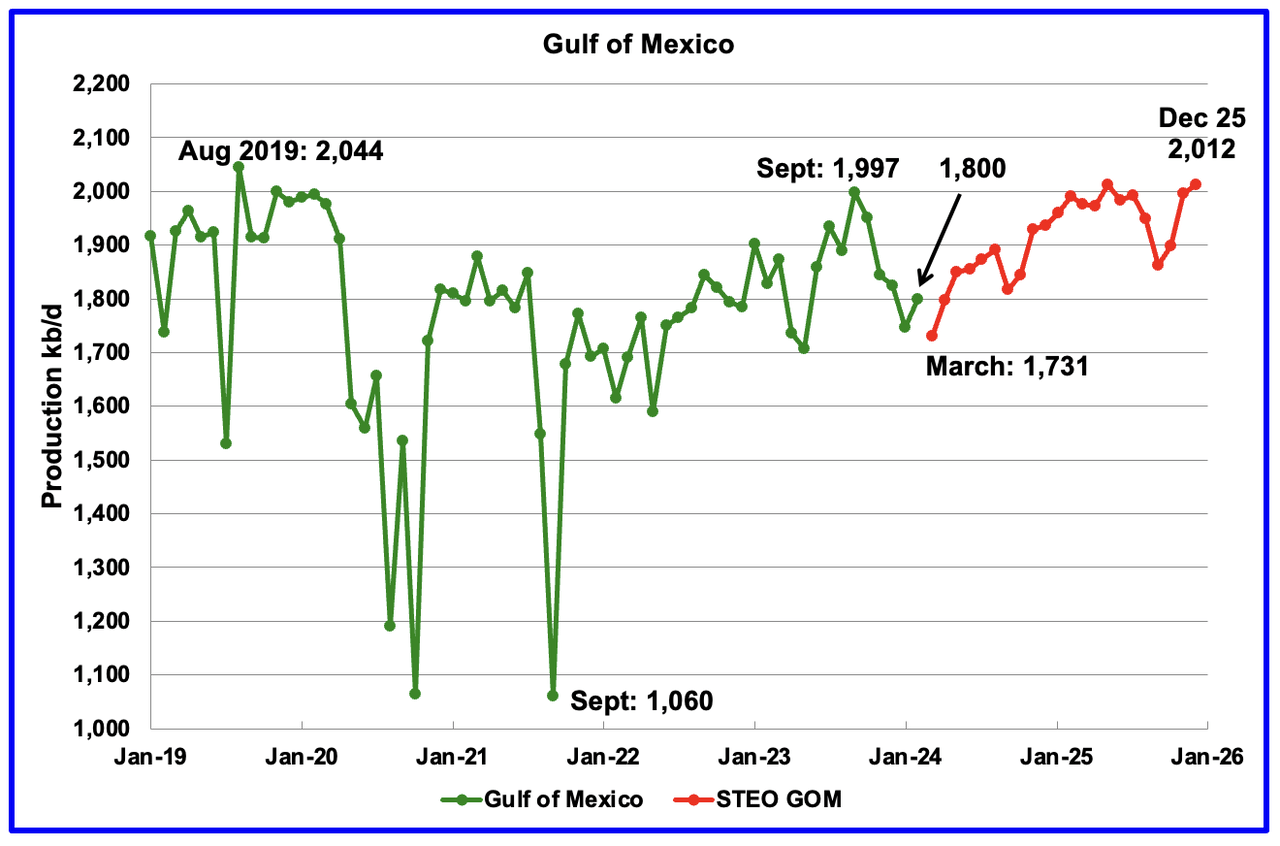
GOM production rose by 53 kb/d in February to 1,800 kb/d but is expected to drop in February by 69 kb/d to 1,731 kb/d.
The April 2024 STEO projection for the GOM output has been added to this chart. It projects production from March 2024 to December 2025 will increase by 281 kb/d to 2,012 kb/d, 27 kb/d lower than reported in the previous STEO.
A Different Perspective on US Oil Production
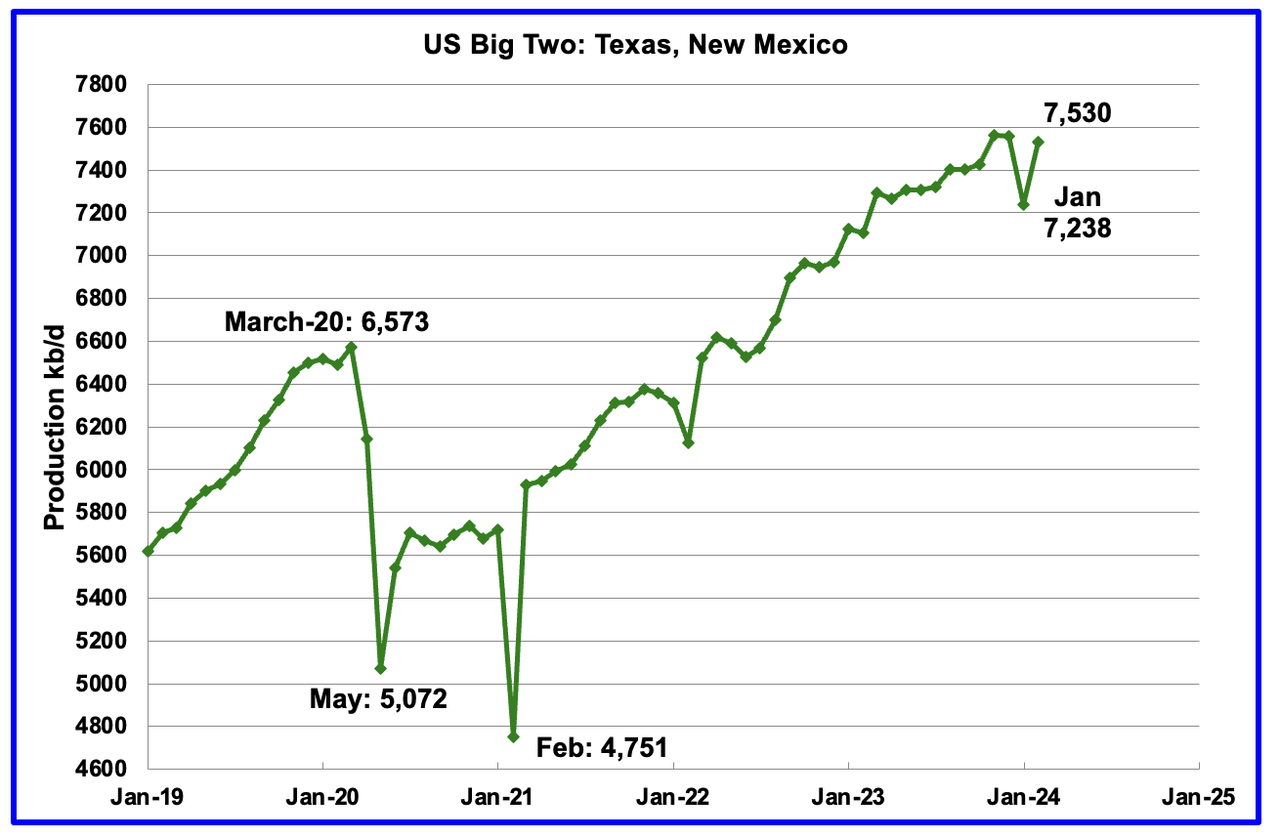
The Big Two states’ combined oil output for Texas and New Mexico.
February’s production in the Big Two states increased by a combined 292 kb/d to 7,530 kb/d with Texas adding 172 kb/d while New Mexico added 120 kb/d.
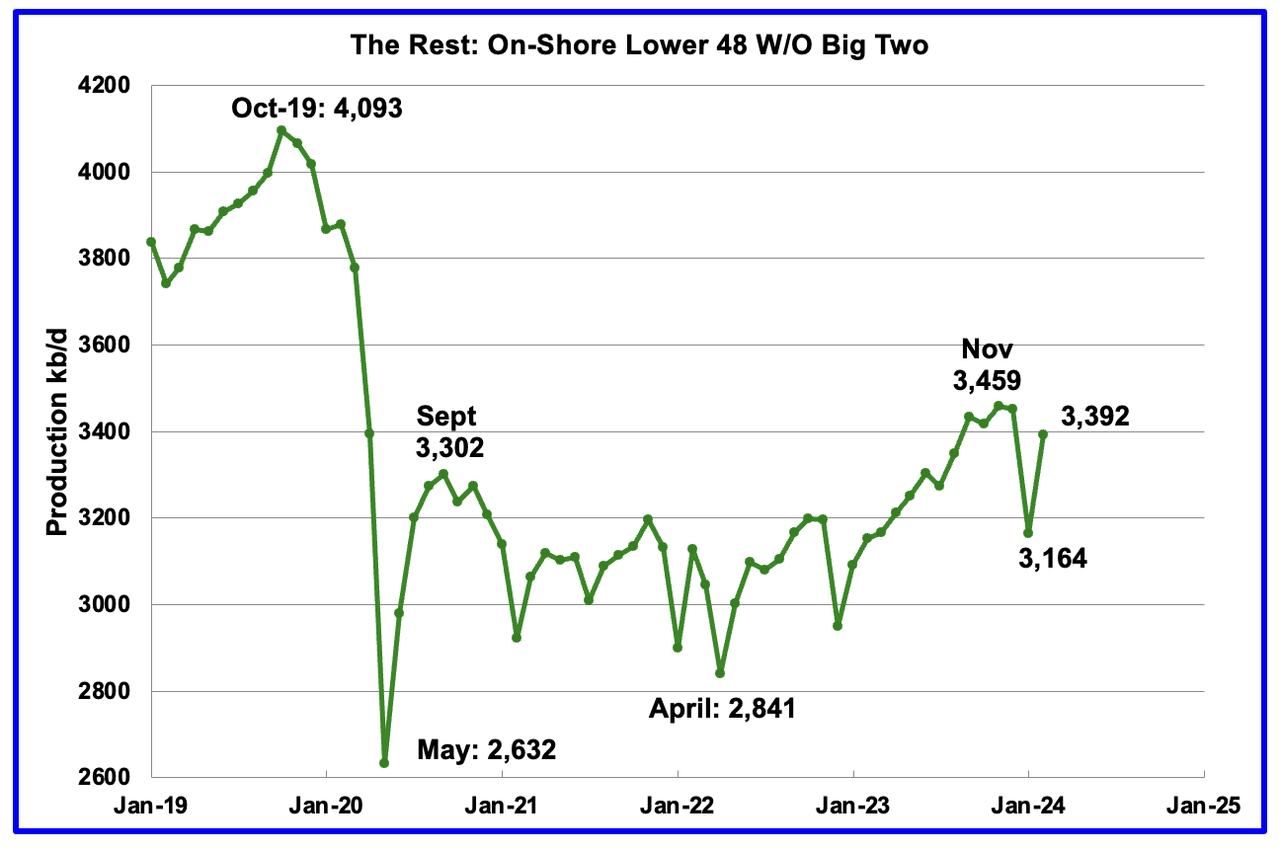
Oil production by The Rest
February’s oil production in The Rest increased by 228 kb/d to 3,392 kb/d.
The main takeaway from The Rest chart is that current production is below the high of October 2019 and is a significant loss that occurred during the Covid shut down and is slowly being recovered.
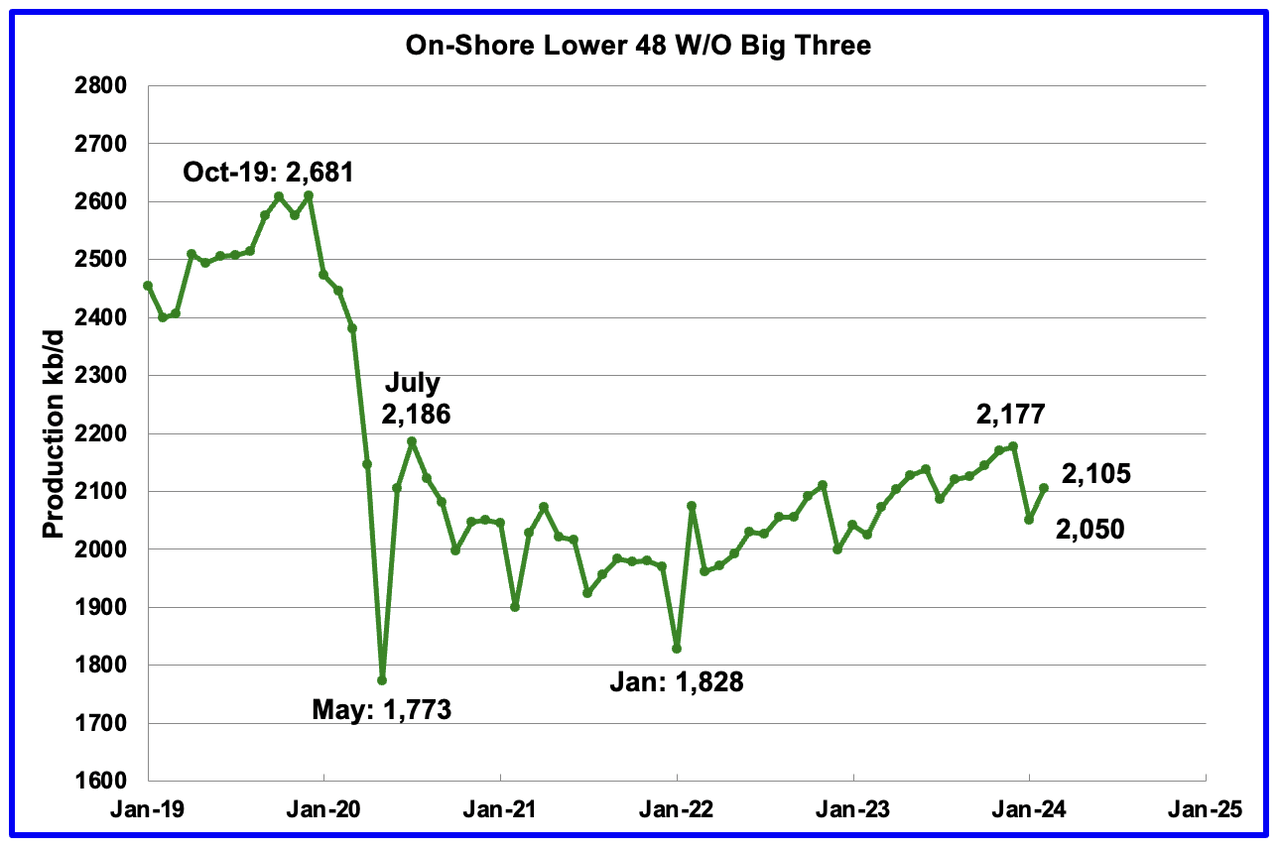
The On-Shore lower 48 W/O the big three, Texas, New Mexico and North Dakota, shows a slow rising production trend from the low of January 2022. February’s production increased by 55 kb/d to 2,105 kb/d.
Permian Basin Report by Main Counties and Districts
This special monthly Permian section was recently added to the US report because of a range of views on whether Permian production will continue to grow or will peak over the next year or two. The issue was brought into focus recently by the Goehring and Rozencwajg Report which indicated that a few of the biggest Permian oil producing counties were close to peaking or past peak. Also comments by posters on this site have similar beliefs from hands on experience.
This section will focus on the four largest oil producing counties in the Permian, Lea, Eddy, Midland and Martin. It will track the oil and natural gas production and the associated Gas Oil Ratio (GOR) on a monthly basis. The data is taken from the state’s government agencies for Texas and New Mexico. Typically the data for the latest two or three months is not complete and is revised upward as companies submit their updated information. Note the natural gas production shown in the charts that is used to calculate the GOR is the gas coming from both the gas and oil wells.
Of particular interest will be the charts which plot oil production vs GOR for a county to see if a particular characteristic develops that indicates the field is close to entering the bubble point phase. While the GOR metric is best suited for characterizing individual wells, counties with closely spaced horizontal wells may display a behaviour similar to individual wells due to pressure cross talking . For further information on the bubble point and GOR, there are a few good thoughts on the intricacies of the GOR in an earlier POB comment. Also check this EIA topic on GOR.
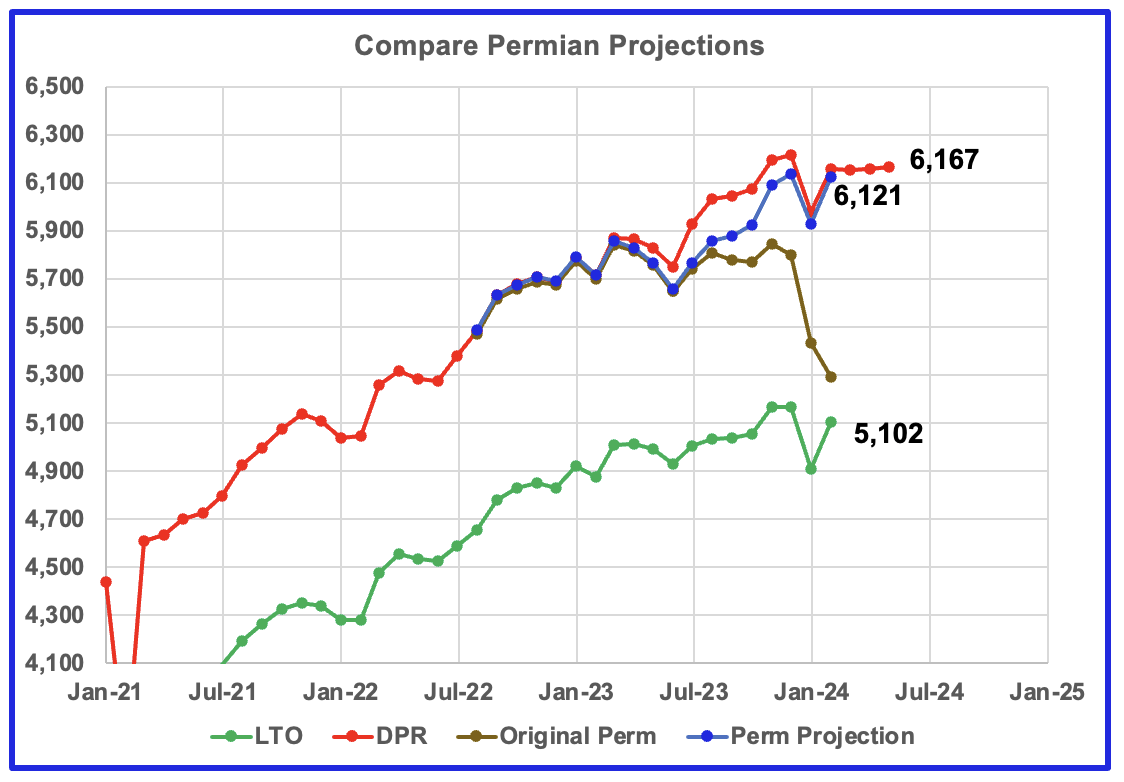
This chart shows four oil production graphs for the Permian basin updated to February and to May for the DPR. The gap between the DPR and LTO projections is there because the DPR projection includes both LTO oil along with oil from conventional wells in the basins that it covers.
The red and green graphs show oil production as published by the EIA’s DPR and the LTO offices. Comparing the two, it appears that both the LTO and DPR offices believe Permian LTO production is currently in a plateau/declining phase. The blue graph is a projection for Permian oil production. The brown chart is the sum of Permian production data as taken from the Texas RRC and the New Mexico Oil Conservation Division. The big January drop is due to severe weather in the central US.
The blue Permian projection graph only uses two months of preliminary production data, January and February, from the New Mexico OCD and the Texas RRC to make its February projection.
The initial attempt to project the Texas and Permian results using the same methodology as used to projectNew Mexico production has not been successful. A modification has been introduced for projecting Texas results and limited back testing was undertaken. It will take a few more months of Texas data to see if the modification gives reasonable results for Texas and the Permian.
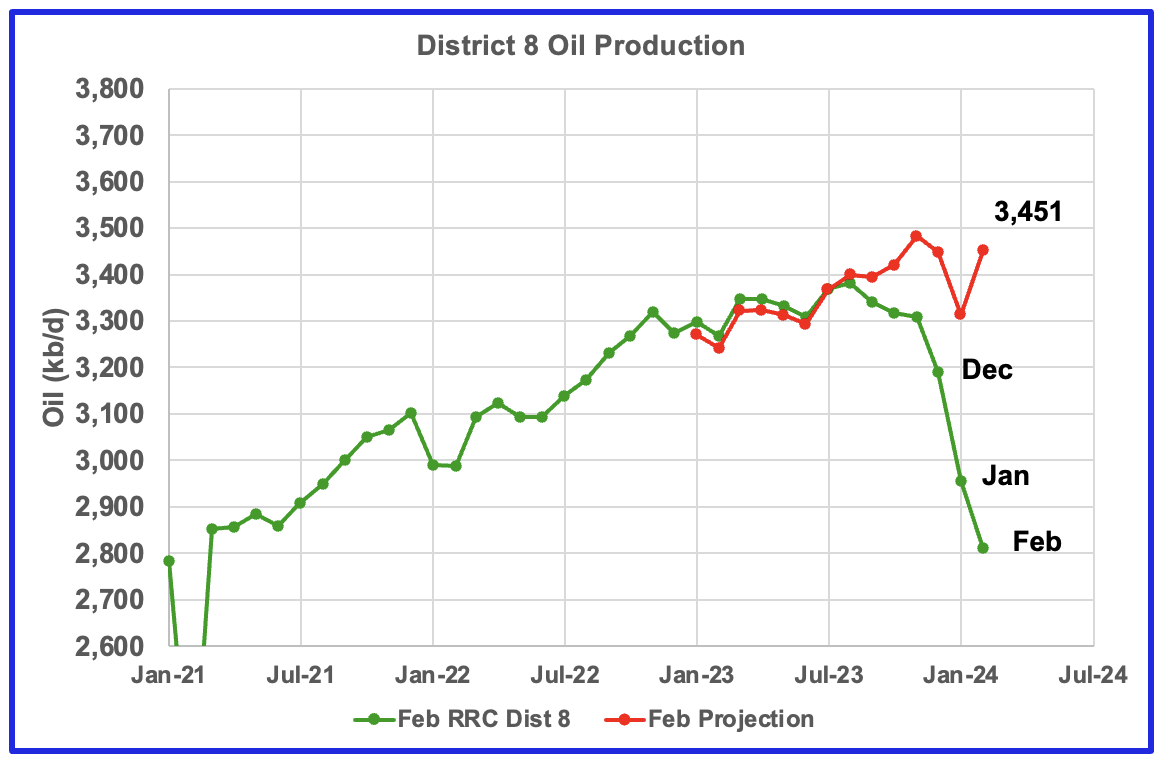
One possible source of error affecting the Texas projections may be the large increase in February production reported by the Texas RRC. Typically the February/January drop is larger than the January/December drop. In this case, the opposite is true. Is this related to the big January drop or is it a real increase in February production? The modification in the methodology results in February’s production projection coming in lower than December.
New Mexico Permian
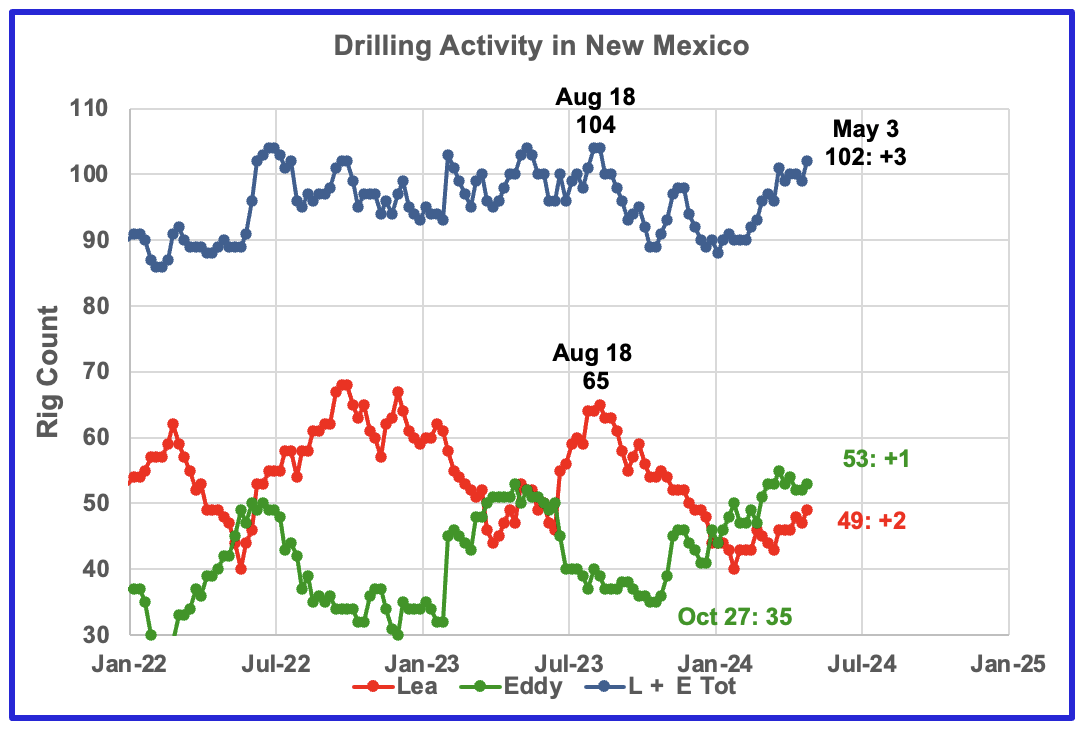
Since the middle of August 2023, the Lea county rig count has dropped from 65 rigs to 40 rigs in late January. By the first week of May the rig count had rebounded to 49. At the same time production has increased slightly to 1,150 kb/d over the period January 2023 to February 2024. See next chart.
From a low of 35 rigs in late October, 20 rigs moved into Eddy county at its peak, 55. Currently 53 are operating. Something is happening in Eddy county which will take at least six months to show up.
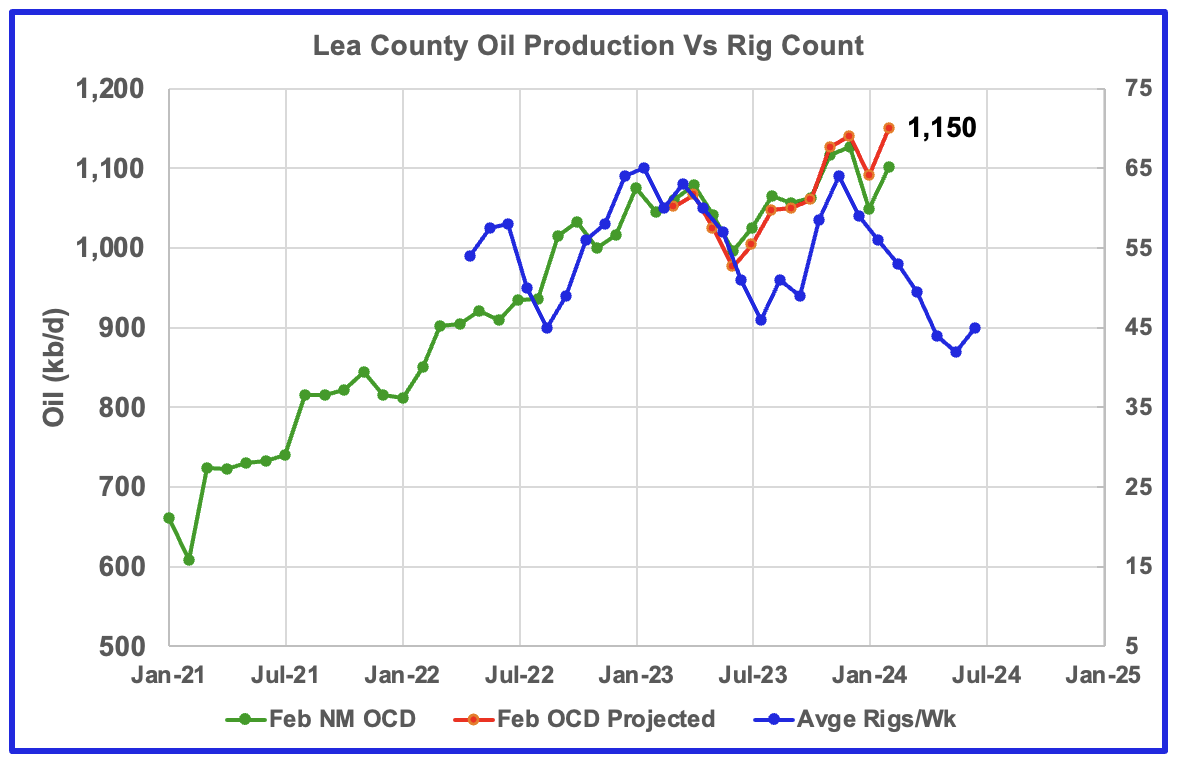
Preliminary February data indicates Lea County oil production increased by 52 kb/d to 1,101 kb/d. A projection for February’s final production estimates it will be close to 1,150 kb/d. NoviLabs in its latest update reported January Lea county production was 1,008 kb/d from 5,996 wells. Their estimate is lower than the 1,101 kb/d because NoviLabs only reports production from horizontal wells.
The blue graph shows the average number of weekly rigs operating during a given month as taken from the above weekly rig chart. The rig graph has been shifted forward by 3 1/2 months. So the 64 Rigs/wk operating in August 2023 have been moved forward to mid November 2023 to show the possible correlation and time delay between rig count and oil production. If the oil production were to follow the rig count going forward, oil production in Lea County should begin to drop in March or April.
The December/January rig drop may be foretelling that Lea county is close to peak production. Note there has been very little production increase since November 2023, 1,127 kb/d to 1,150 kb/d in February 2024.
Note that rig counts are being used to project production as opposed to completions because very few DUCs are being completed at this time.
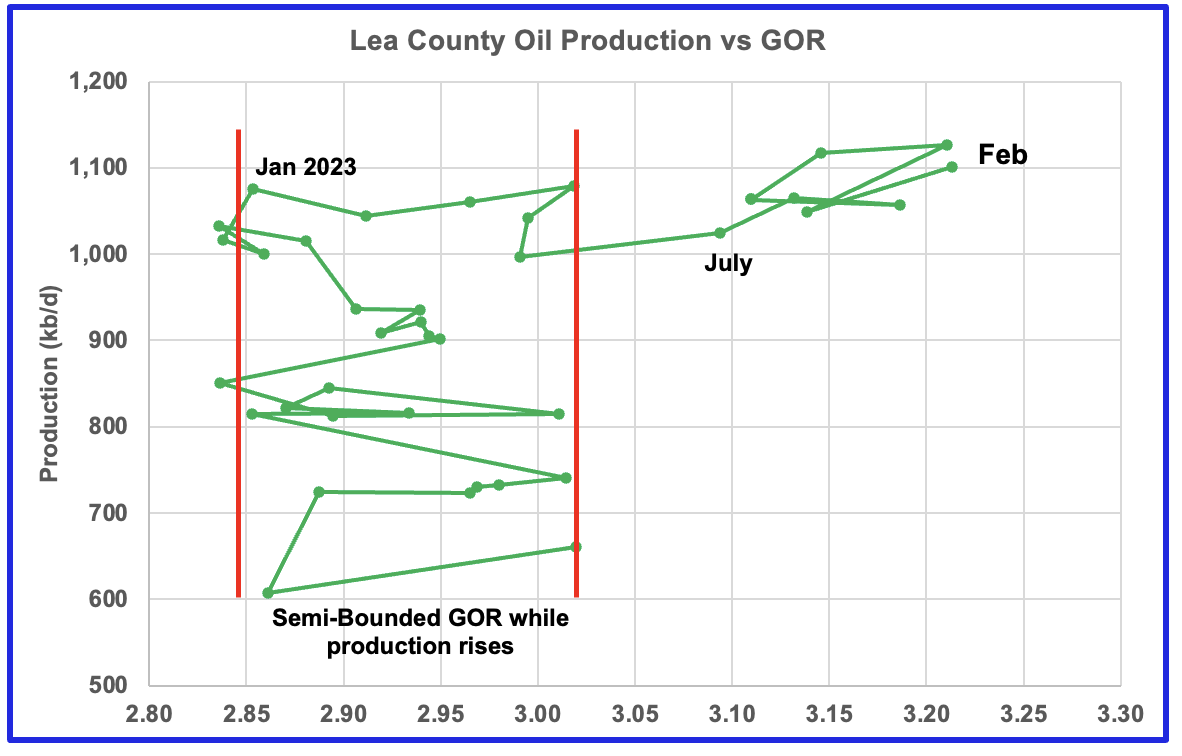
After much zigging and zagging, oil production in Lea county stabilized just above 1,000 kb/d. Once production reached its new high in January 2023, production essentially plateaued but the GOR started to increase rapidly to the right and entered the bubble point phase in July 2023.
From January 2023 to December 2023, the GOR increased rapidly from 2.85 to 3.22. In comparison, note that from January 2021 to June 2023, the GOR remained within the semi bounded range of 2.85 to 3.02.
Preliminary December 2023 oil production in Lea county hit a new high of 1,127 kb/d. However January production dropped to 1,049 kb/d due to cold weather and the GOR reversed direction. February saw both an increase in production to 1,101 kb/d and an increase in the GOR to 3.21, tied with December 2023.
This zigging and zagging GOR pattern within a semi-bounded GOR while oil production increases to some stable level and then moves out to a higher GOR to the right has shown up in a number of counties. See an additional two cases below. This is the eighth month in which Lea county has registered a GOR outside the semi-bounded GOR range.
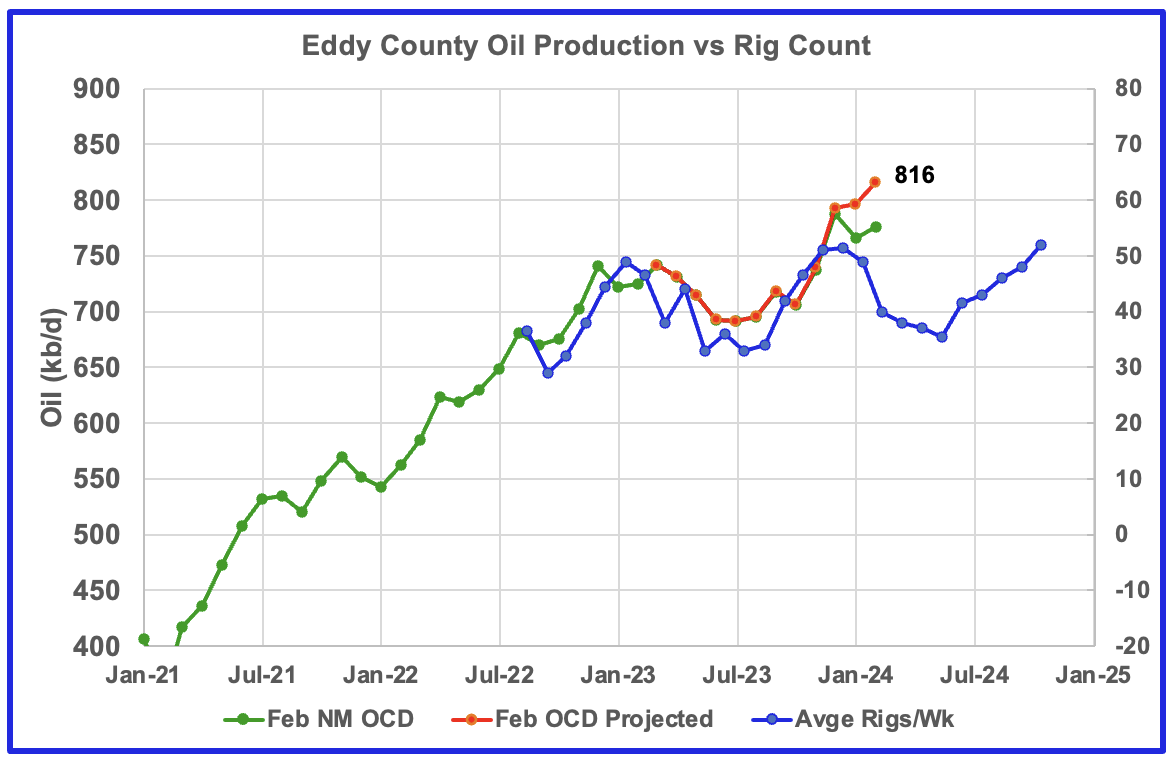
Eddy county oil production was showing signs it was in a plateau phase up to October 2023. However, production began to rise in November and hit a new projected high of 816 kb/d in February. The rising production must be associated with the large increase in the rig count starting in February 2023.
The blue graph shows the average number of weekly rigs operating during a given month as taken from the above weekly drilling chart. The rig graph has been shifted forward by 7 1/2 months to roughly coincide with the production graph. Note the difference in rig time shift between Lea county 3 1/2 months vs 71/2 months for Eddy.
If production were to follow the rig count trend going forward, Eddy production should begin to drop in March before rising again starting in June/July.
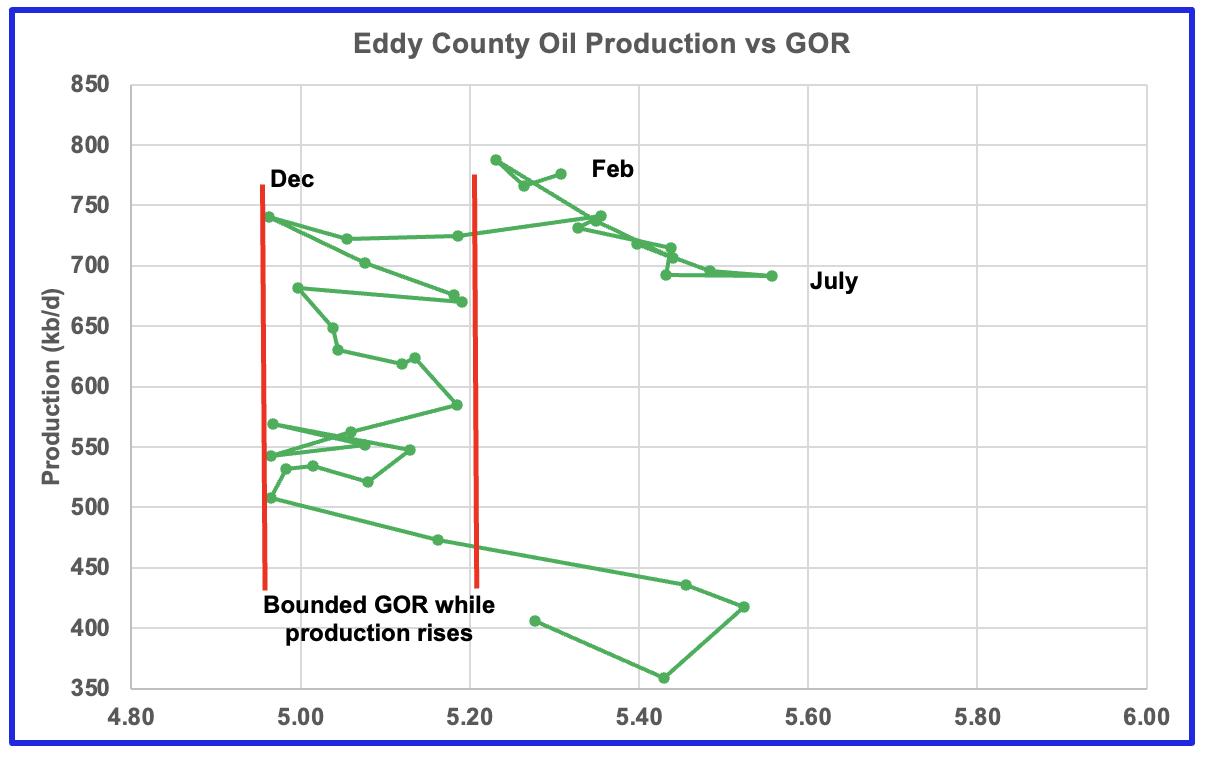
The Eddy county GOR pattern is similar to Lea county except that Eddy broke out from the semi bounded range earlier and for a longer time. For the last three months preliminary oil production has been bouncing between 750 kb/d and 800 kb/d.
August 2023 saw a reversal in the increasing GOR trend by decreasing which then was followed by the current oil production increase which reached a new high in December 2023, an atypical pattern. Could this indicate that drilling in Eddy county has punched into a new bench or are some old wells being refracted?
Texas Permian
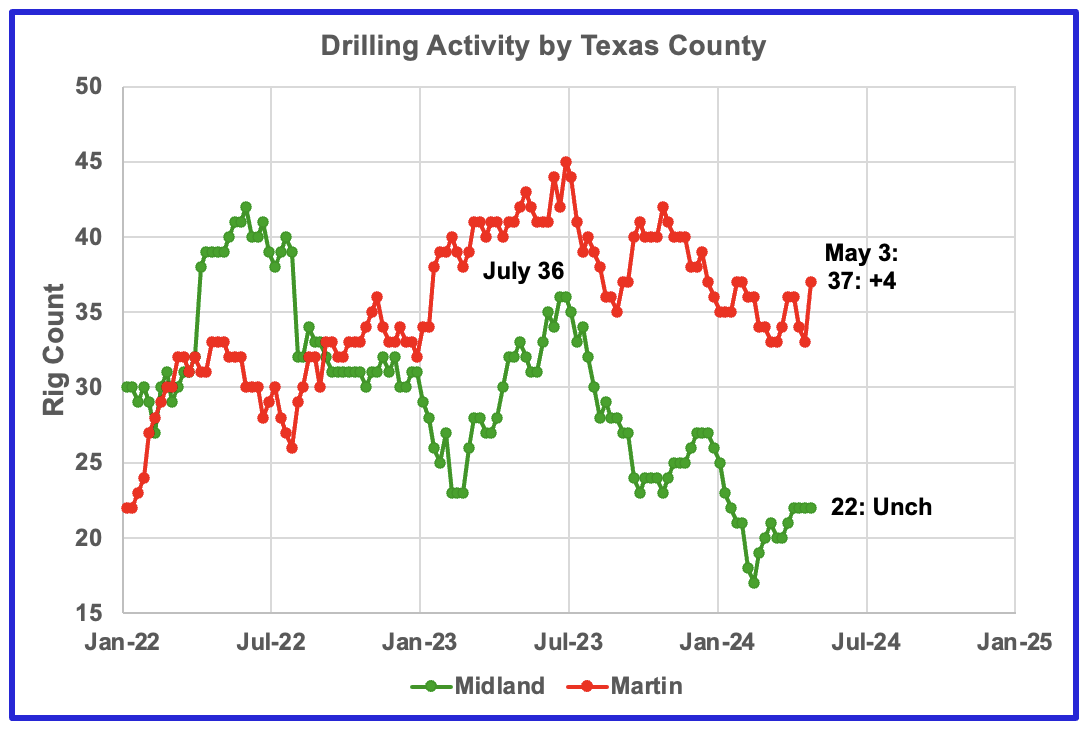
The rig count in Midland county started to reverse its downtrend and began to increase in late February 2024 but is still down 14 rigs from July 2023. Martin county rigs remain close to the lows of 2024, but rose by 4 in the week ending May 3 and are down 8 from the peak in July 2023.
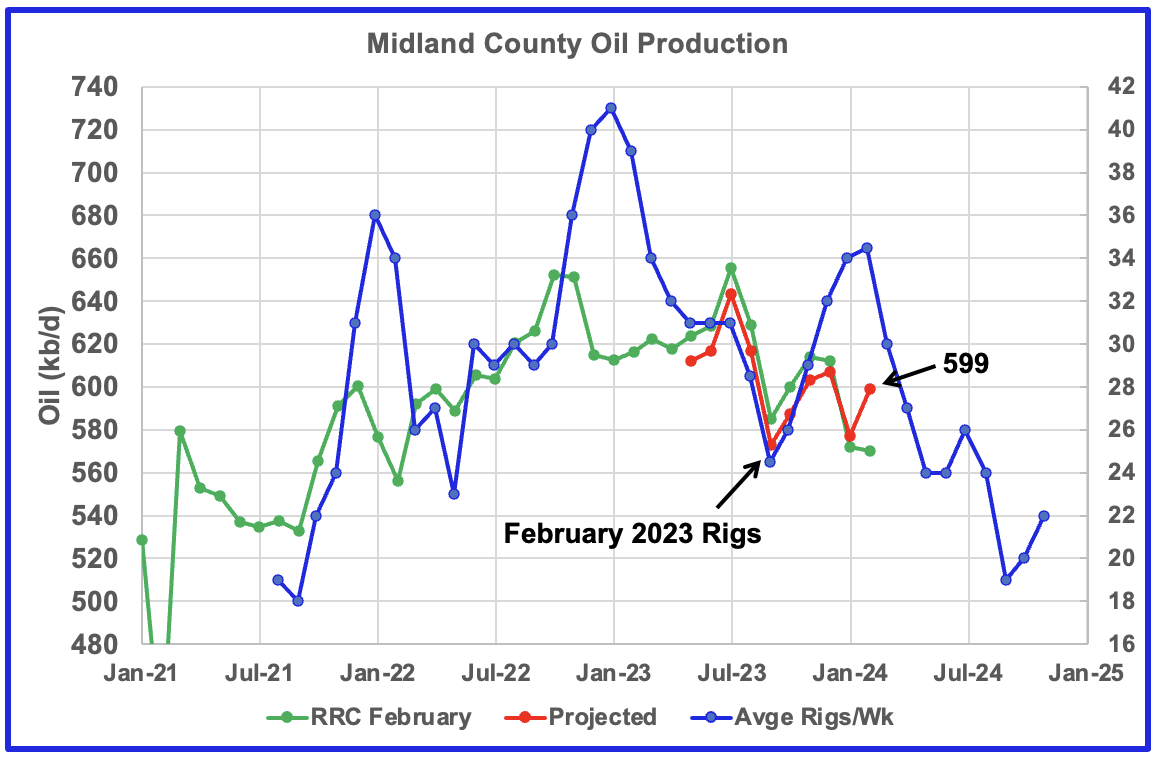
Midland County oil production began to rise again in October 2023, based on a projection. After the January drop February’s production rebounded to 599kb/d, red graph. The green graph shows February’s preliminary production as reported by the Texas RRC. Note the small February drop. The rising production starting in October 2023 may be related to the rising drilling activity which started in March 2023. If correct, this implies Midland production peaked in July 2023.
The blue graph shows the average (approximate) number of weekly rigs operating during a given month as taken from the previous weekly drilling chart. The rig graph has been shifted forward by seven months. So the 34 Rigs/wk operating in August 2023 have been moved forward to January 2024 to show the possible correlation and time delay between rig count and oil production. If the seven month shift in the rig count is approximately correct in that oil production can be tied to the rig count, oil production in Midland county should resume its decline after March/April 2024.
In the NoviLabs January update on the Permian, Enno Peter’s chart indicates the Midland subbasin production will be flat from 2024 going forward while the Delaware will continue to grow and output will be twice as large as the Midland by 2030. Difficult to square those comments with talk of the Permian peaking shortly.
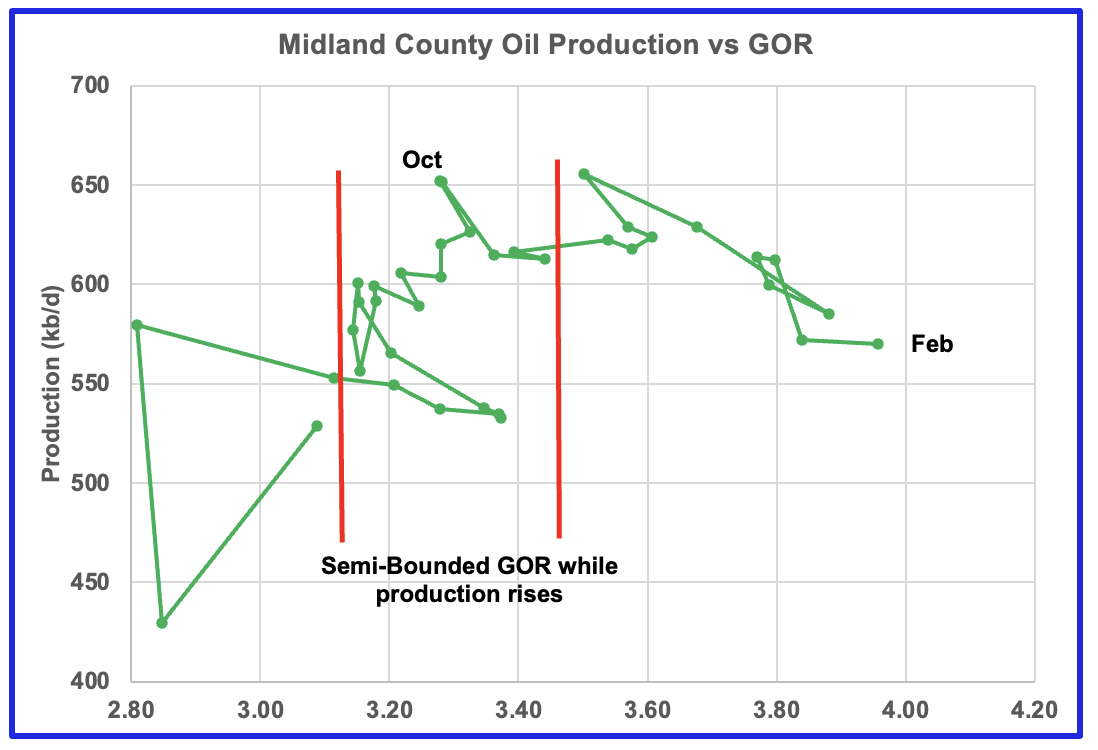
With Midland county deep into the bubble point phase, oil production continues to drop, based on the previous graph and should resume dropping in March/April. Note that oil production and GOR in this chart is based on the RRC February data.
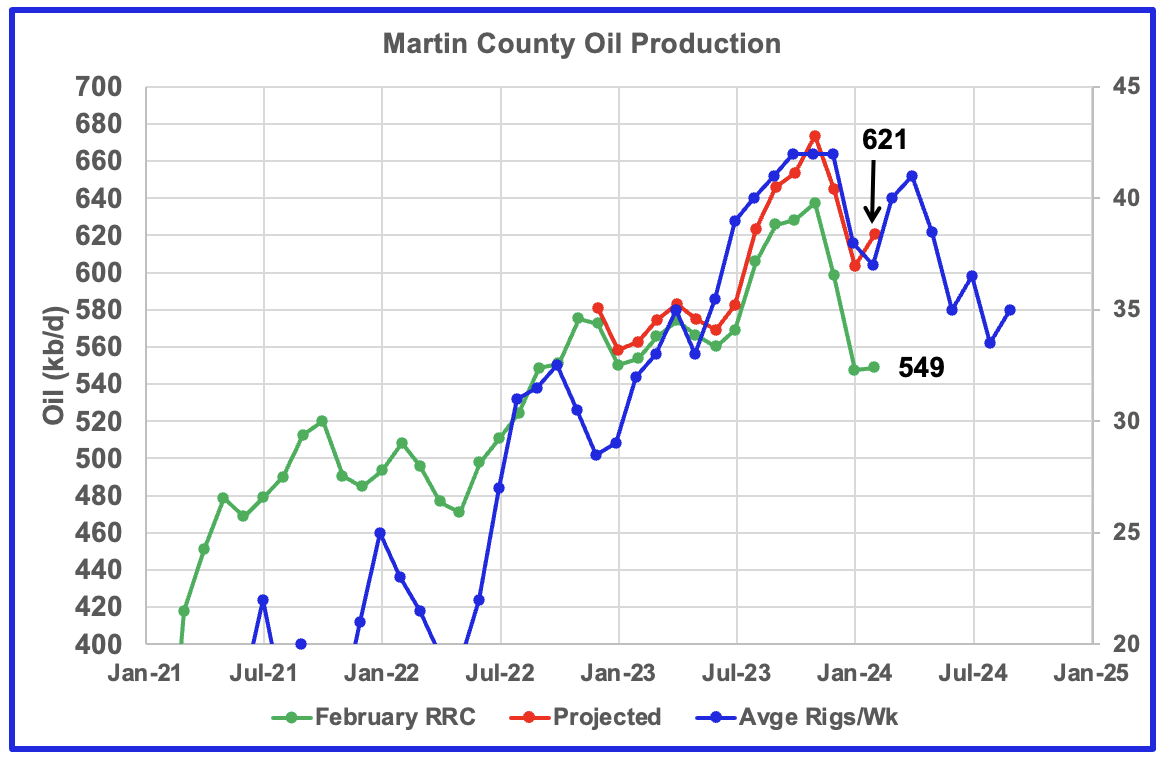
This chart shows the Texas RRC oil production for Martin County. It is showing initial signs of peaking in November 2023. The projection indicates February production was close to 621 kb/d and is lower than November 2023. The projection is also hinting at the beginning of a declining phase as it appears production is tracking the rig count graph since early 2023.
The red graph is a production forecast which the Texas RRC could be reporting for Martin county about one year from now as drillers report additional updated production information. This projection is based on a modified methodology that used January and February production data and will be re-estimated each month going forward.
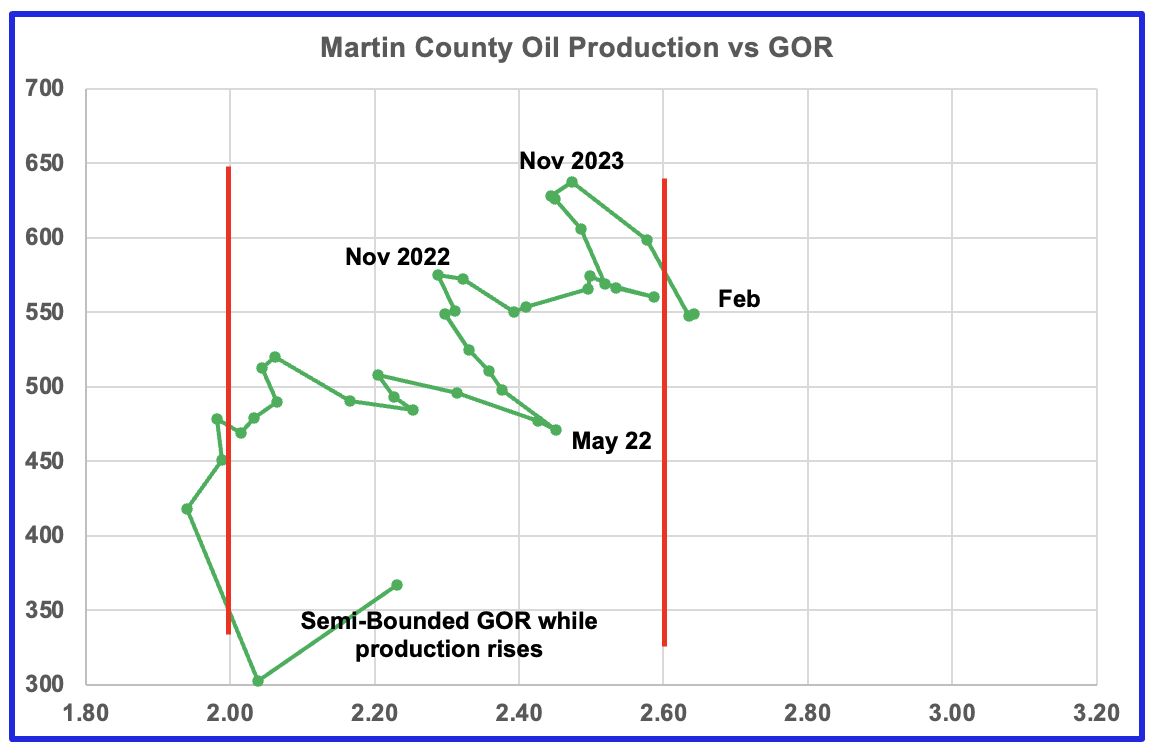
Martin county’s oil production and GOR up to December 2023 stayed within the semi bounded range and near peak oil production. However January and February saw the GOR move slightly out of the semi-bounded range for the first time. Martin county has the lowest GOR of the four counties at a GOR of 2.64. Martin may be on the verge of entering the bubble point phase that results in a dropping oil production trend.
Exactly where to put the right hand red GOR boundary for Martin county is not exactly obvious. It is possible that the right boundary should be closer to a GOR of 2.5. The GOR started to reverse direction in June 2022 as oil output rose to a new high in November 2023. In December 2023 the GOR began to increase and production began to drop. The GOR has been increasing since then and production has dropped. This makes it more likely that Martin county entered the bubble point phase in either December 2023 or January 2024. A few more months of data will clarify the situation.
Findings
Forecast oil production continues to rise for Lea and Eddy counties. However the rise is due to increased drilling activities from months back and production may be near a peak as drilling activity starts to decline.
Martin and Midland counties may have peaked and entered a declining phase.
Texas District 8
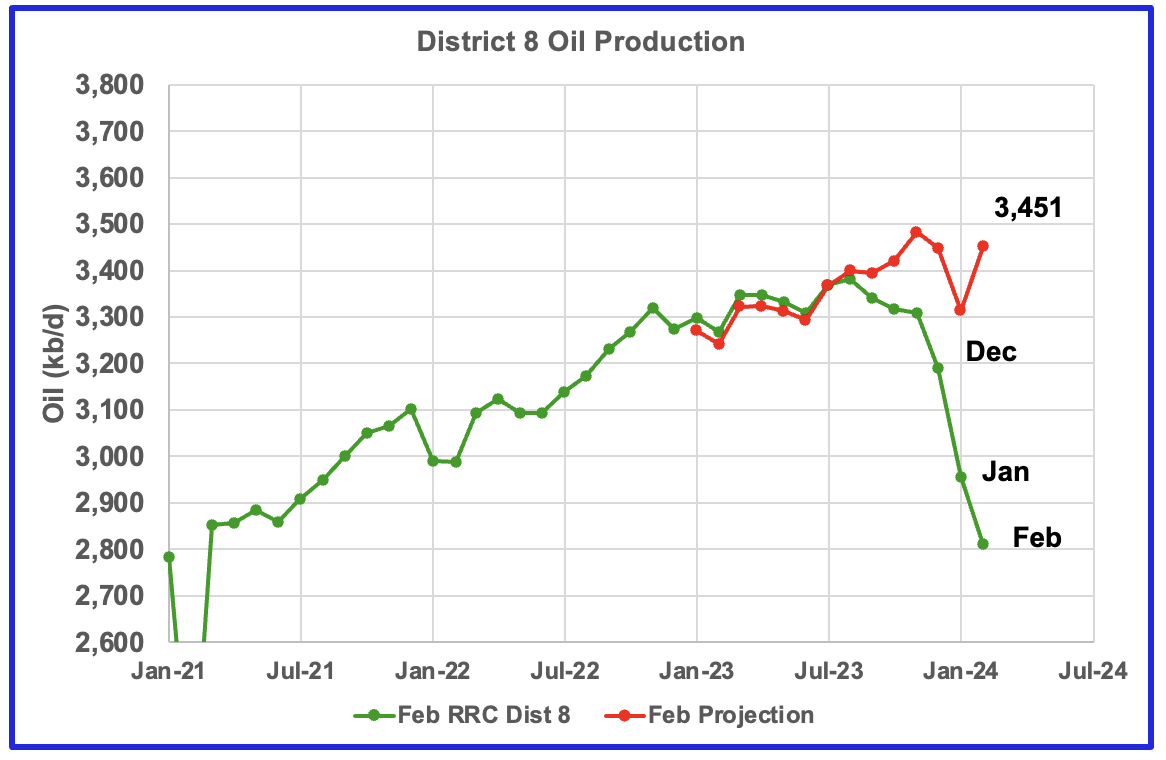
Texas District 8 contains both the Midland and Martin Counties. Combined these two counties produce close to 1,200 kb/d of oil. While these two counties are the two largest oil producers, there are many other counties with smaller production, Reeves #3 and Loving #4, that results in total production of close to 3,700 kb/d. Essentially the Midland and Martin counties produce 1/3 of the District 8 oil.
This chart shows a projection for District 8 oil production. The red graph, derived from January and February production data indicates that oil production in District 8 may be entering a plateau phase. The February increase is a rebound from the January weather induced production drop.
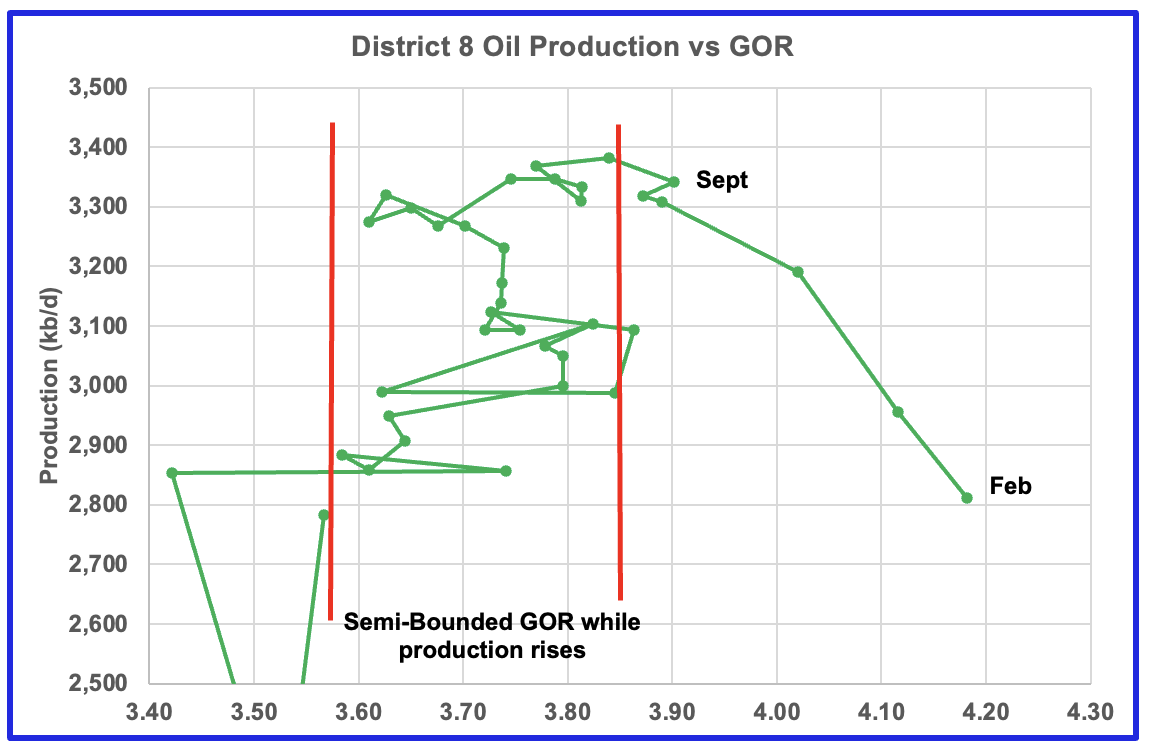
Plotting an oil production vs GOR graph for a district may be a bit of a stretch. Regardless here it is and it seems to indicate many counties may well be into the bubble point phase.
Drilling Productivity Report
The Drilling Productivity Report (DPR) uses recent data on the total number of drilling rigs in operation along with estimates of drilling productivity and estimated changes in production from existing oil wells to provide estimated changes in oil production for the principal tight oil regions. The April DPR report forecasts production to May 2024 and the following charts are updated to May 2024. The DUC charts and Drilled Wells charts are updated to March 2024.
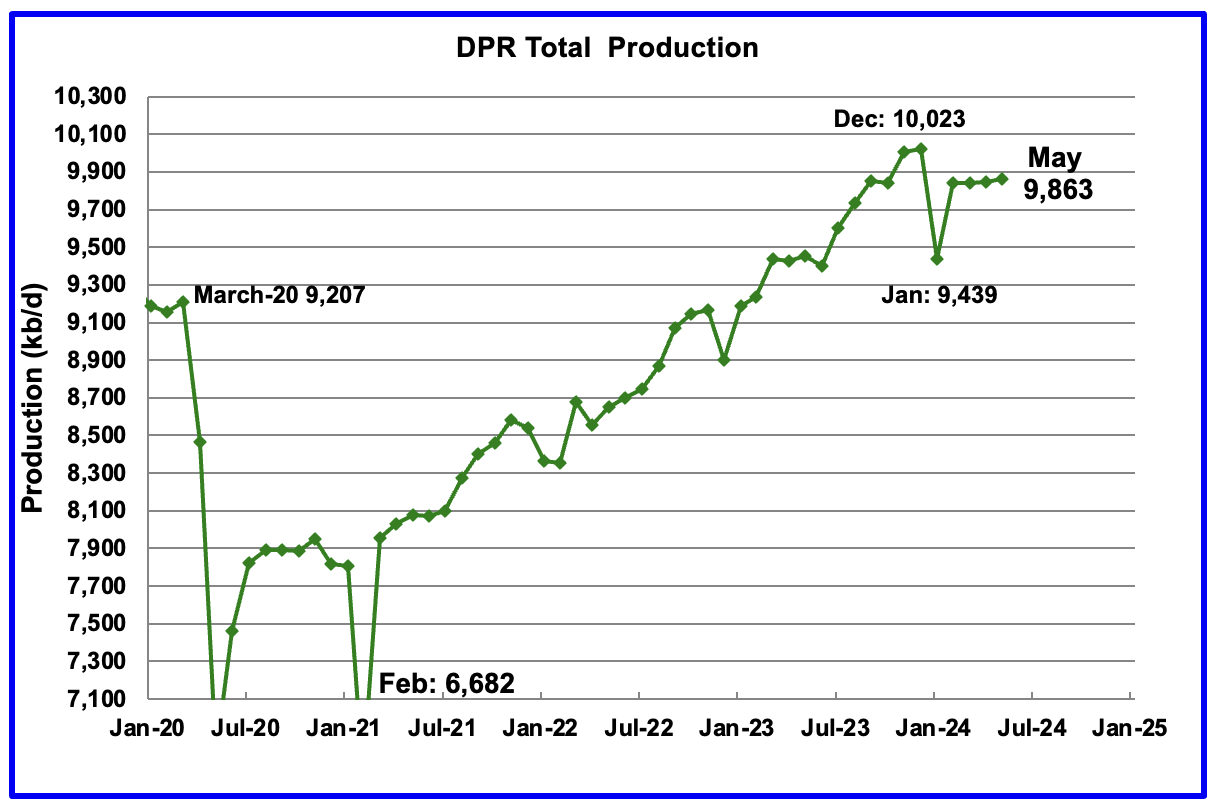
Above is the total oil production projected to May 2024 for the 7 DPR basins that the EIA tracks. Note DPR production includes both LTO oil and oil from conventional wells.
The DPR is projecting oil output for May 2024 will increase by 16 kb/d to 9,863 kb/d.
The April DPR report has also made an upward revision to its previous production forecast. For April, production was revised up by 79 kb/d to 9,847 kb/d. The large January drop is related to severe winter weather across the central US.
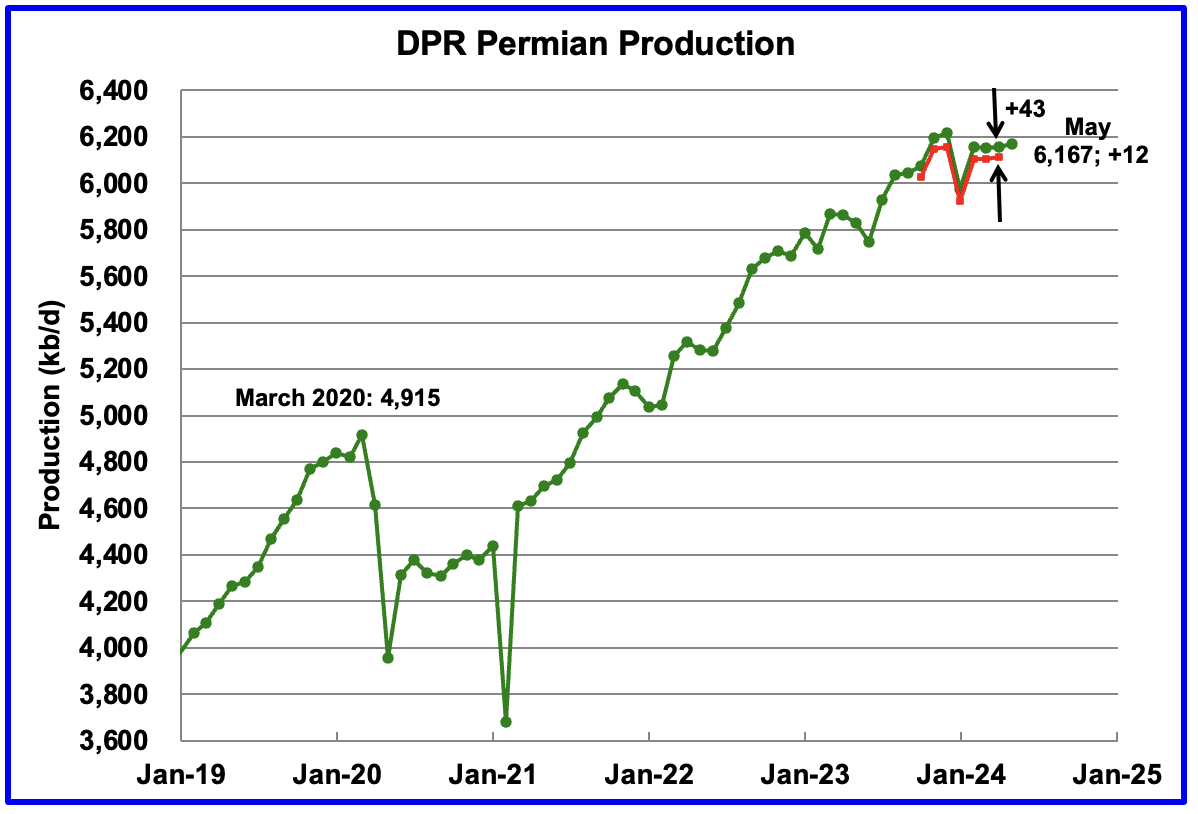
According to the EIA’s April DPR report, Permian output will continue its slow rise in May. It is expected to increase by 12 kb/d to 6,167 kb/d. The last four months of Permian production show a slowing trend in monthly production growth. The red markers show the DPR’s previous forecast.
While the May increase is small, the Permian’s output for April was revised up by 43 kb/d. All in all, May’s production is up 55 kb/d from April.
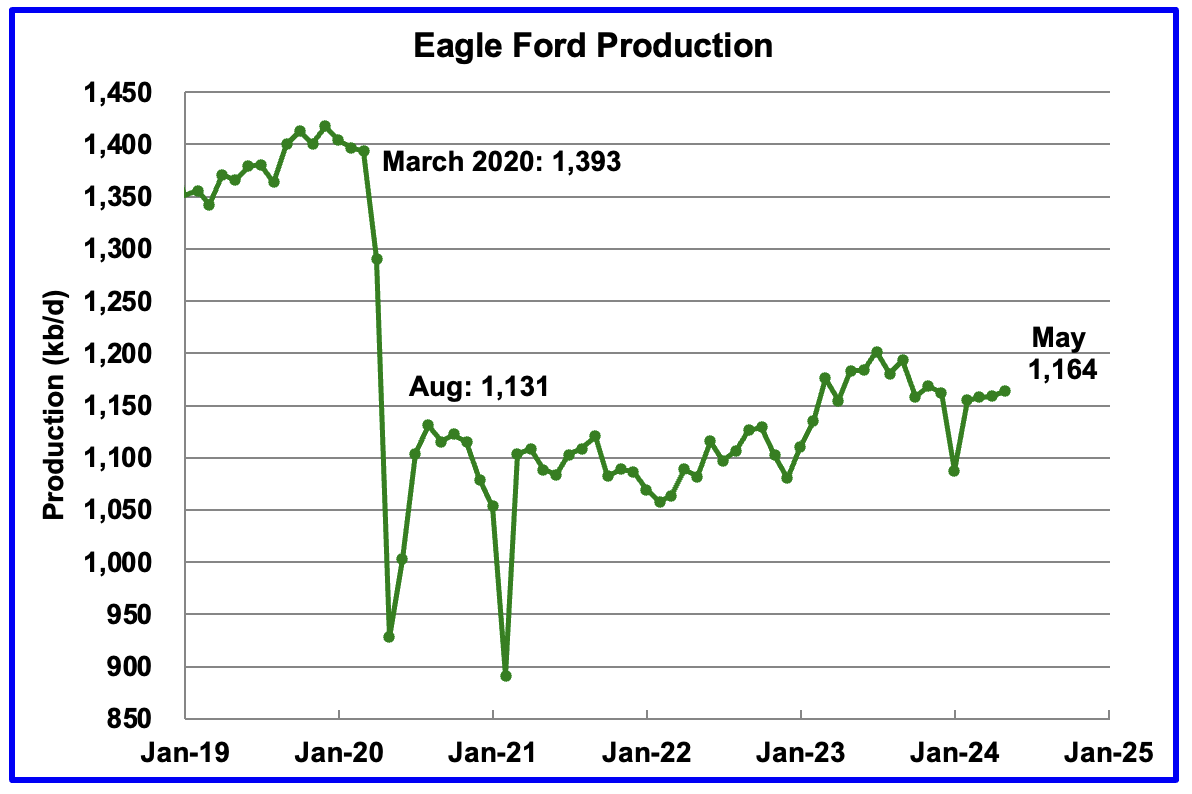
Output in the Eagle Ford basin has been on a plateau since November. The DPR’s April forecast projects May output will increase by 5 kb/d to 1,164 kb/d.
Since the beginning of 2024, the Eagle Ford rig count has been close to 47 ± 2 rigs. The current rig count is 47 which may account for its relatively flat output.
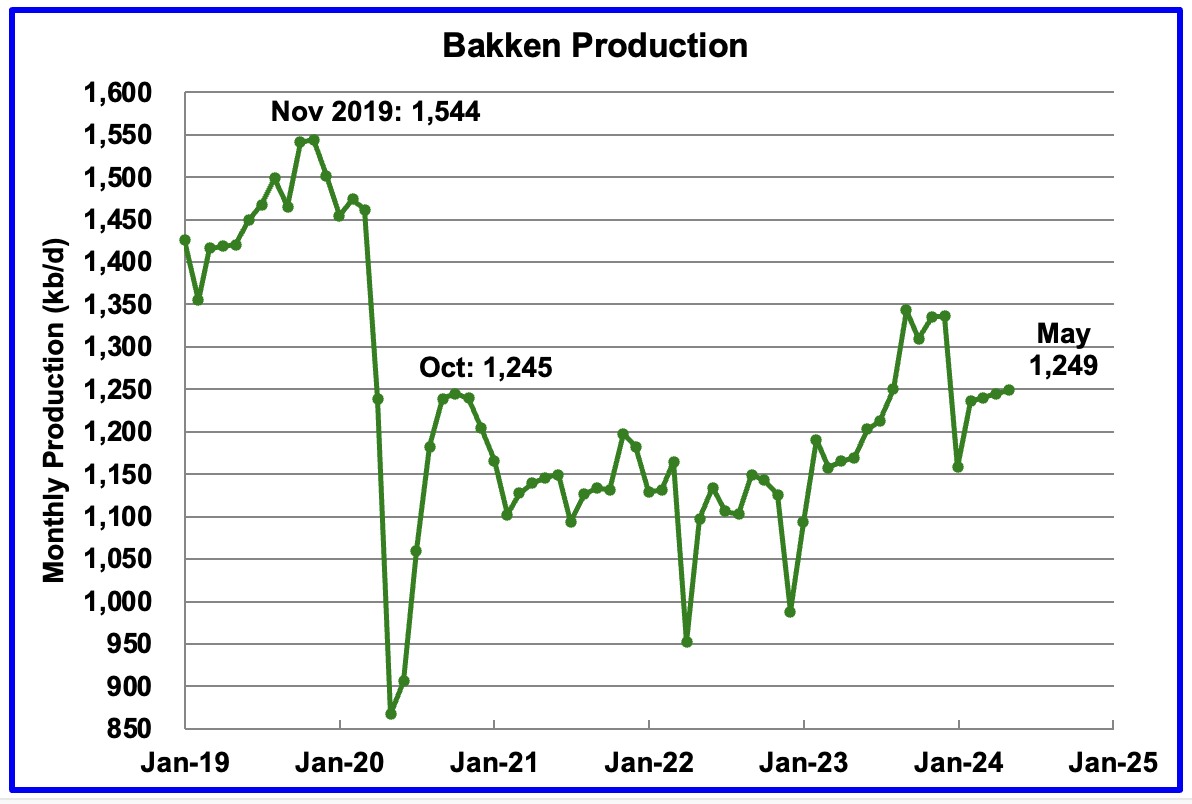
The DPR forecasts Bakken output in May will be 1,249 kb/d, 4 kb/d higher than April. May 2024 production has now exceeded the 1,245 kb/d produced in October 2020 by 4 kb/d.
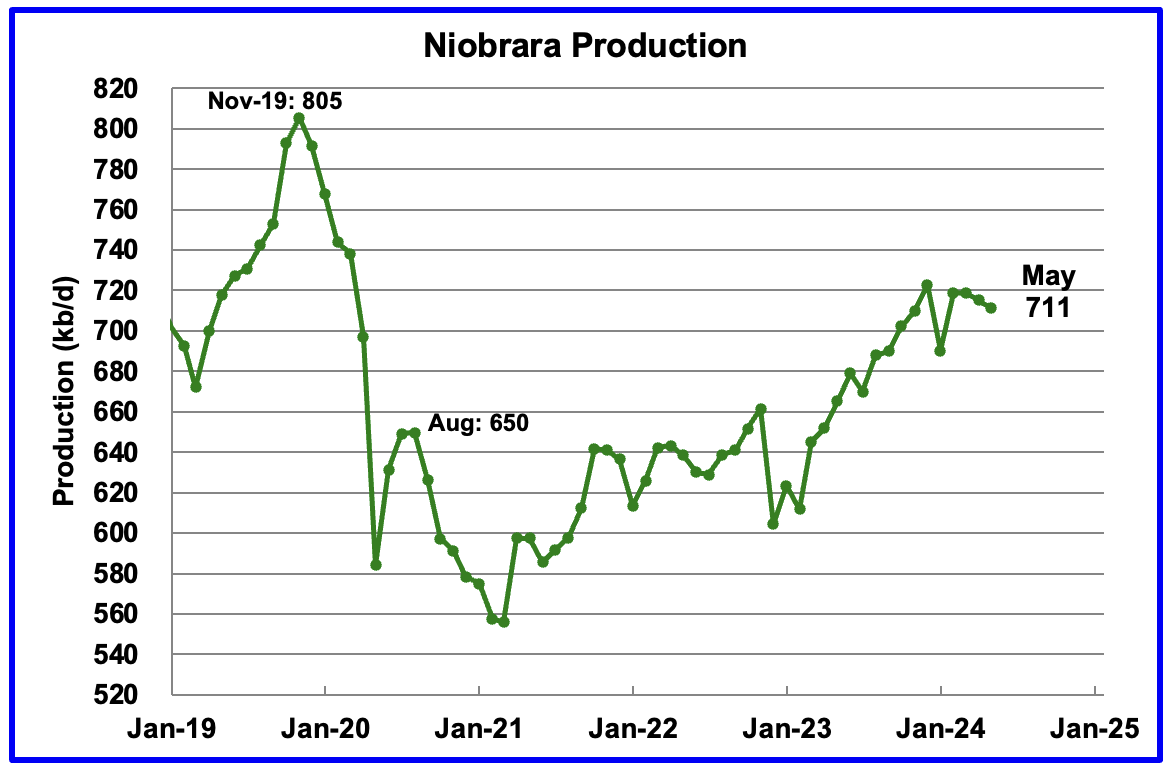
Output growth in the Niobrara continues to slow and may have turned into a slow declining phase. May’s output decreased by 4 kb/d to 711 kb/d.
DUCs and Drilled Wells
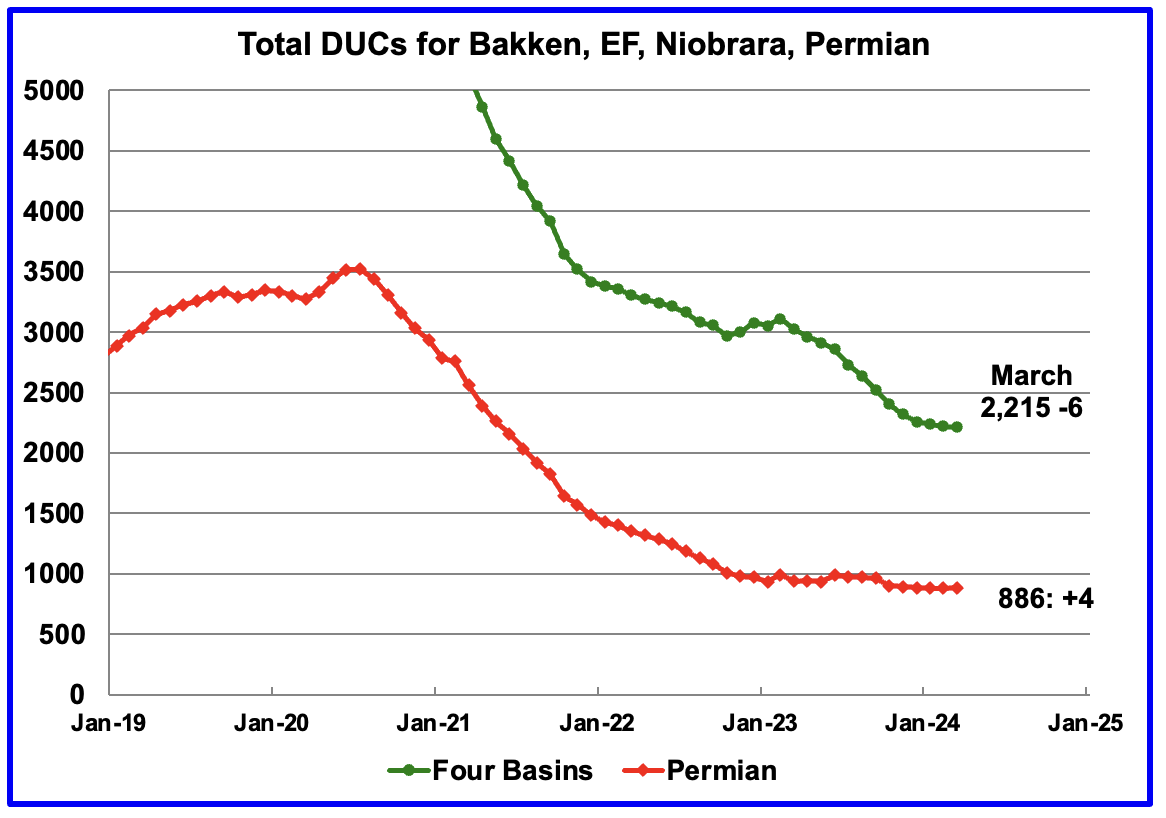
The number of DUCs available for completion in the Permian and the four major DPR oil basins has fallen every month since July 2020. March DUCs decreased by 6 to 2,215. In the Permian, the DUC count increased by 4, a rare event.
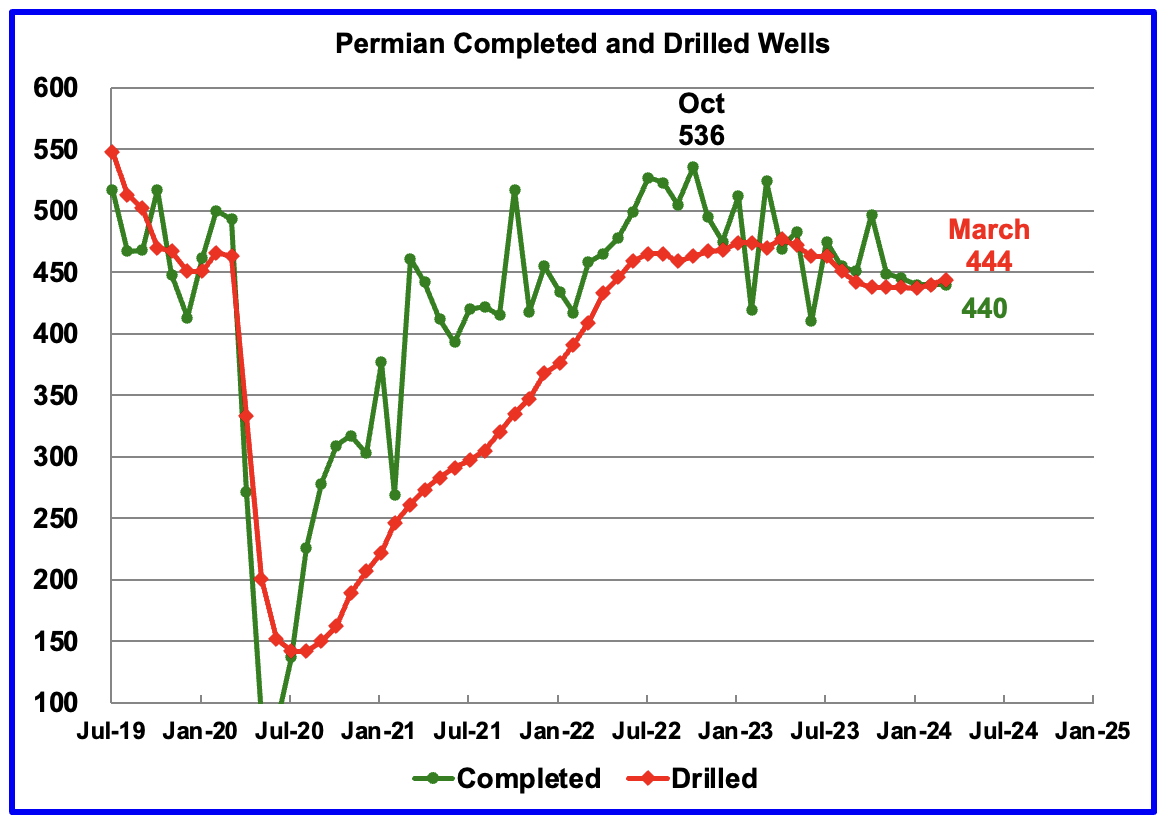
In the Permian, the monthly completion and drilling rates have been both stabilizing in the 440 to 445 range over the last six months.
In March 2024, 440 wells were completed while 445 new wells were drilled. This is the first month in almost a year where the number of wells drilled exceeded the completions.
Rig and Frac Spread Report.
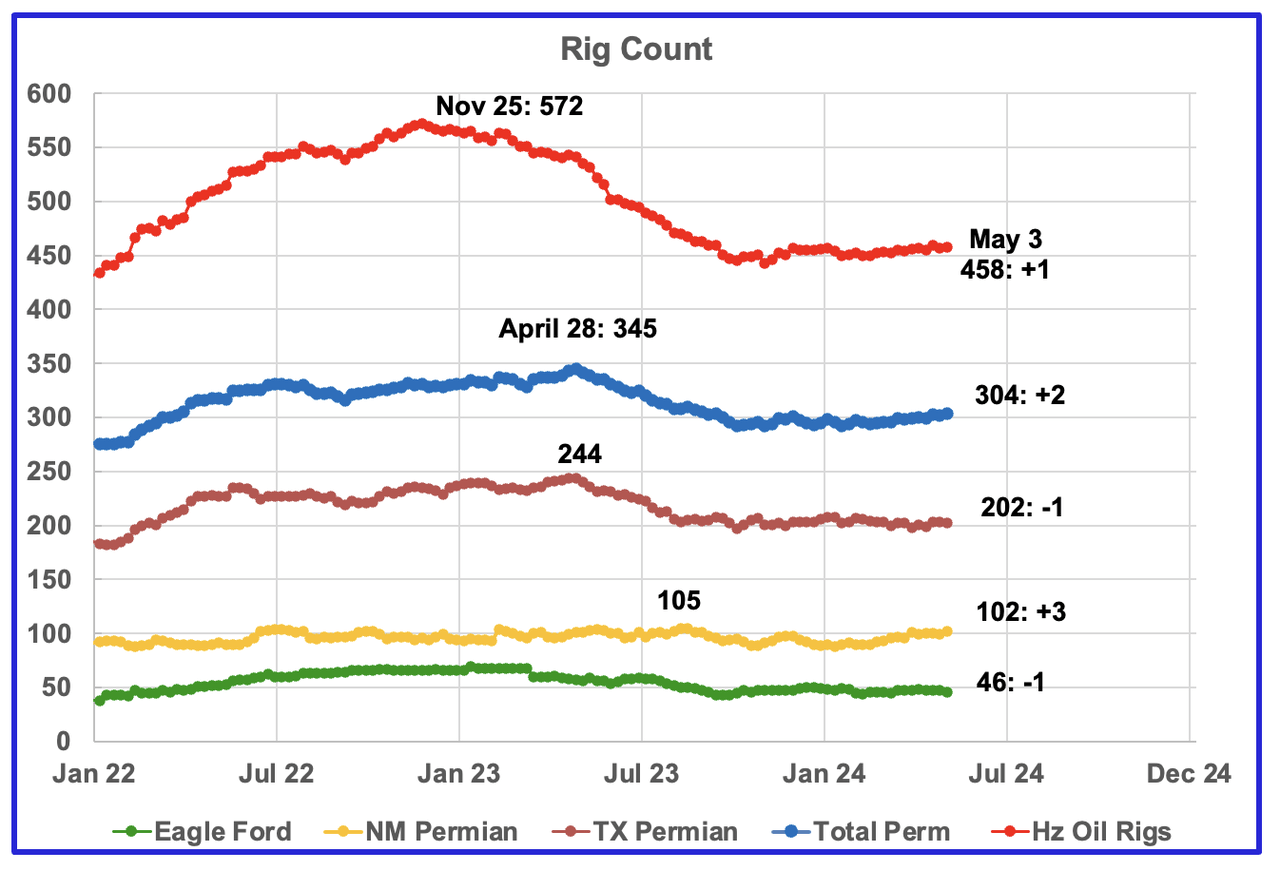
The Rig report for the week ending May 3.
- US Hz oil rigs increased by 1 to 458. The rig count has been slowly increasing since November 3, 2023 when it was 443 and is up 15 since then.
- Permian rigs added 2 to 304 and also have been slowly increasing since November 2023.
- Texas Permian was down 1 to 202 while NM was up 3 to 102. In New Mexico, Lea county added 2 to 49 while Eddy added 1 to 53. In Texas Martin was rose 4 to 37 and Midland was unchanged at 22
- Eagle Ford dropped 1 to 46
- NG Hz rigs were down 1 to 91. (Not shown)
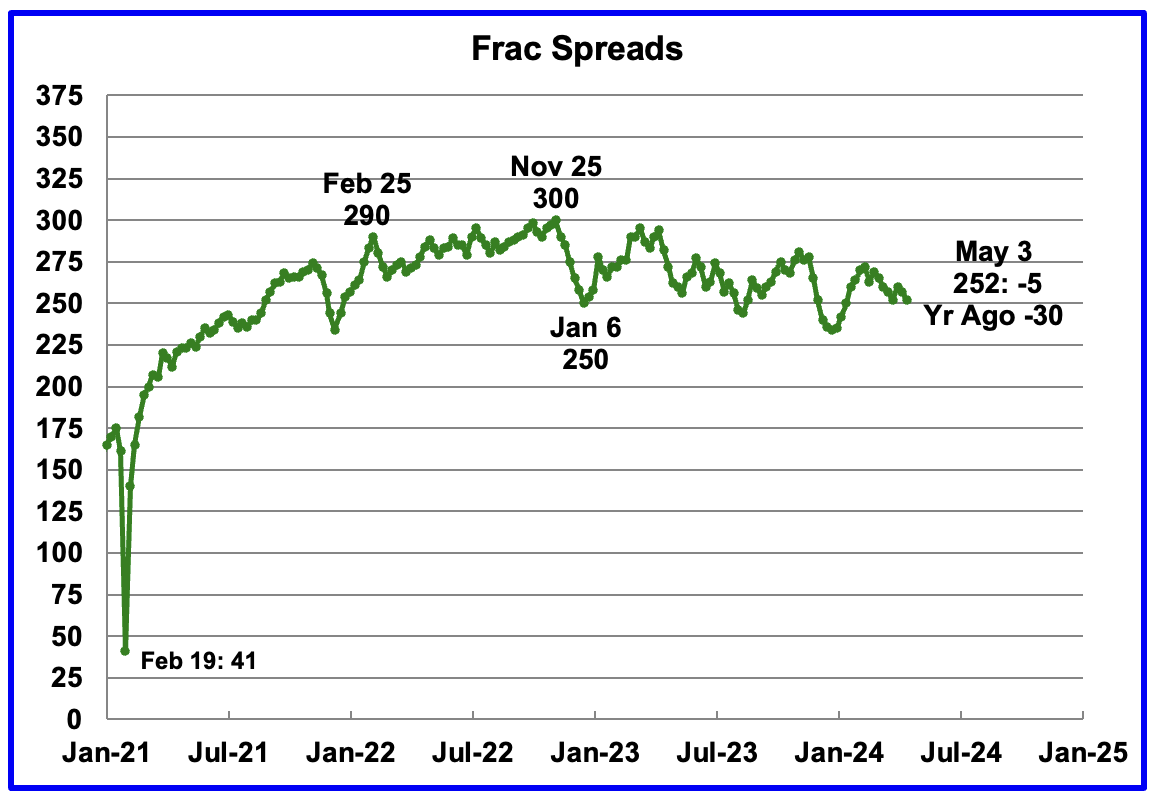
Frac Spread report for the week ending May 3.
The frac spread count was down 5 to 252 and is down 30 from one year ago. How high will the Frac count go in 2024? The chart continues to indicate the frac spread count will bounce between 250 and 275 going forward.
New Fracking Technology
According to this article “New technology helps US shale oil industry start to rebuild well productivity“
Simul-fracking is helping to reduce the cost of fracking but it requires many wells to be drilled up front and this requires a lot of funding the large companies can afford but smaller ones can’t.
“While overall output is at record levels, the amount of oil recovered per foot drilled in the Permian Basin of Texas, the main U.S. shale formation, fell 15% from 2020 to 2023, putting it on par with a decade ago, according to energy researcher Enverus.”
“Two decades of drilling wells relatively close together, resulting in hundreds of thousands of wells, have interfered with underground pressure and made getting oil out of the ground more difficult.”
“After doubling over a decade, the amount of oil extracted from each foot drilled in the Permian shale basin has been steadily declining since 2020, Enverus says. Reduced spacing between wells is to blame.”
“Companies now can complete (frack) wells faster and cheaper,” said Betty Jiang, an oil analyst with Barclays.
“A drawback to the new simultaneous fracking technology, also called simul-frac, is that companies need to have lots of wells drilled and ready to move to the fracking phase in unison before they can proceed. Pumps inject fluids into and get oil and gas out of two or three wells at the same time, instead of just one.”
“Simul-fracking can also lower well costs by between $200,000-$400,000, or 5%-10% apiece, said Thomas Jacob, senior vice president of supply chain at researcher Rystad Energy estimates.”
“But the biggest shale producers have committed to using oil revenue to finance shareholder returns rather than drilling expansion. Two of the biggest shale oil operators, Exxon and Chevron, have missed targets for Permian production in the past years.“
“Exxon said its own new fracking technology will allow it to extract an extra 700,000 barrels of oil equivalent per day (boepd) from Pioneer’s assets by 2027, tripling output there to 2 million boepd.”
Original Post
Editor’s Note: The summary bullets for this article were chosen by Seeking Alpha editors.
Read the full article here
