")
An efficient market?
The efficient market theory would lead us to believe that the market, S&P500 (SP500)(VOO), always knows more than we do. That capital will be distributed efficiently and the multiples we pay are rational, either based on values today or values tomorrow. We will always gravitate back toward an equilibrium. That equilibrium is usually thought of as 15 X the earnings of the collective S&P 500, some would now peg it at around 18 X.
Trying to outsmart the system can be considered an unwise decision. Time in the market > timing the market is the typical mantra to avoid market timing. If the market forward multiple is trading above what we consider equilibrium, could there be something we’re missing?
With SAAS and Tech companies that are now profitable leading the market higher, we may have to reassess whether our GAAP based multiple assignment is currently worthwhile.
Combine these very profitable non-GAAP compounders with some new reasons to buy and hold, and we have an interesting combination of items that can keep this market going higher.
Trillion is the new billion
One worry that the market participants bring up in general is the number of companies with a Trillion Dollar or more market cap. This new number in our ethos will not be a fad. The only question is, in my opinion, when do we see the first ten trillion-dollar company? With some companies on track to hit a trillion dollars in top-line revenue in the coming years, it’s merely how many times sales are you willing to pay.
With 6 US publicly listed companies in the Trillionaire’s club that effect the P/E ratio of the market the greatest, the round table currently has the following components :
- Microsoft (MSFT)
- Apple (AAPL)
- NVIDIA (NVDA)
- Alphabet (GOOGL)
- Amazon (AMZN)
- Meta (META)
Our top slice of market concentration is “SaaSy”
I pose a question casting the first stone, since GAAP accounting is the principle on which we base the P/E multiple and GAAP accounting is becoming less relevant than ever due to tax laws, then how expensive is the market? If SaaS companies in particular have several advantageous GAAP loopholes, then why would they pay taxes at all if they could internally compound the top line instead? If your GAAP multiples only improve by paying more taxes, then these two items contradict in certain sectors. I would argue that you can’t both be a “hyper-scaler” and an eager taxpayer at the same time.
The following quip is from Marcelo Lima of the Heller House Opportunity Fund from 2018:
There is another reason “cheap” is a poor proxy for value: the new business models I described above—SaaS in particular—are not well suited to traditional GAAP accounting.Here’s why: if distribution costs are zero, the optimal strategy is to gain as many customers for your software product, as quickly as possible. In digital businesses, there are increasing advantages to scale, and many of these companies operate in winner-take-all or winner-take-most markets. The name of the game is thus to build, grow, then monetize.
Frequently, this means spending a lot of money in sales and marketing, which depresses reported earnings.Thus, SaaS companies spend to acquire customers upfront , and recognize revenue from those customers over many years . This mismatch burdens the income statement. Some of the most successful—and highest performing stocks—in the SaaS world have spent many years growing despite producing no meaningful accounting profits.- Marcelo Lima
CAPEX and OPEX, expensing may compress multiples
Having brought up this topic before in a previous article on Amazon, whom I believe has the greatest operating leverage of all as demonstrated by their leading R&D spend, new CAPEX requirements by these maturing tech companies may compress the market multiple.
With tech companies now competing in the AI space at a rapid clip, more expenses will gravitate toward capitalized expenses rather than operating expenses. Hard capital versus human capital. This should reduce the immediate capability of several of these companies to write off expenses on the operating line of the income statement, and they will pay more taxes as a result. In short, more GAAP income and more EPS. If they have to spend more dollars on things that cannot be immediately expensed, they will have to cut somewhere else. R&D budgets and SG&A might be targeted.
Add back analysis and operating leverage of the Fab 5
Here is a simple analysis of the 5 companies that I would consider to have the highest operating leverage, where Research and Development expense is not crucial to company profitability. The 5 companies I used for consideration are Amazon, Google, Microsoft, Apple, and Meta.
| TTM P/E | S&P 500 weighting | weighted average contribution | |
| AMZN | 51.47 | 3.70% | 1.904 |
| GOOGL | 27.27 | 3.92% | 1.068 |
| MSFT | 38.16 | 7% | 2.671 |
| AAPL | 34.92 | 7.09% | 2.475 |
| META | 27.42 | 2.25% | 0.616 |
| total | 23.96% | 8.737 |
Looking at the trailing 12-month multiples, we can see an elevated average well above 30 X GAAP earnings, contributing greatly to the high market multiple. The Vanguard S&P 500 (VOO) was used as a weighting resource.
We can see that as a group, the weighted average contribution to the S&P 500 P/E ratio is 8.73 points.
| AMZN | 85162 | 63871.5 | 42581 | 21290.5 |
| GOOGL | 43897 | 32922.75 | 21948.5 | 10974.25 |
| MSFT | 28193 | 21144.75 | 14096.5 | 7048.25 |
| AAPL | 30348 | 22761 | 15174 | 7587 |
| META | 37407 | 28055.25 | 18703.5 | 9351.75 |
| TTM R&D expense | 75% | 50% | 25% |
With R&D being the target of operating leverage visualization, the above chart shows the amount of proposed capital that could be backed out of the system and added to GAAP profitability. Determining how much could be backed out is hard to nail down, but at least 25% of the budget was left as a reminder in all scenarios.
All numbers in millions of USD
| TTM NET INCOME | AMZN | 37684 | 101555.5 | 80265 | 58974.5 |
| GOOGL | 82406 | 115328.75 | 104354.5 | 93380.25 | |
| MSFT | 86181 | 107325.75 | 100277.5 | 93229.25 | |
| AAPL | 100389 | 123150 | 138324 | 107976 | |
| META | 45758 | 73813.25 | 64461.5 | 46758.75 | |
| 75% add back | 50% add back | 25% add back |
The above would be modified GAAP net income measures with 75,50 and 25% of R&D added back to net income.
| MODIFIED P/E RATIOS | AMZN | 18.8 | 23.79 | 32.38 |
| GOOGL | 19 | 21.08 | 23.55 | |
| MSFT | 30.46 | 32.60 | 35.07 | |
| AAPL | 27.93 | 24.86 | 31.85 | |
| META | 16.39 | 18.77 | 25.87 | |
| 75% add back | 50% add back | 25% add back |
The above are modified P/E ratios at the 75,50 and 25% add back levels.
New weighted contribution based on average R&D add backs
| Average modified TTM P/E ratios | S&P 500 weighting | weighted average contribution | |
| AMZN | 24.99 | 3.70% | 0.92463 |
| GOOGL | 21.23 | 3.92% | 0.832216 |
| MSFT | 32.7 | 7% | 2.289 |
| AAPL | 28.22 | 7.09% | 2.000798 |
| META | 20.34 | 2.25% | 0.45765 |
| total | 23.96% | 6.50 |
Difference 8.7-6.5= 2.2 points shaved off the S&P 500 P/E ratio using the average of all the modified “add back” P/E ratios. This is a full 25% less than the GAAP net income contribution of these companies.
While these 5 companies are the biggest contributors to this GAAP income anomaly, there are certainly other candidates in the S&P 500 that would qualify for this consideration as well on a smaller scale.
A compounding riddle
Here is a famous compounding analogy that is commonly given to fund managers to test cognitive biases:
In a lake, there is a patch of lily pads. Every day, the patch doubles in size. If it takes 48 days for the patch to cover the entire lake, how long would it take for the patch to cover half the lake?
Even individuals from esteemed Ivy League schools have a hard time getting this right when posed with the question.
The answer is 47
Numbers compound slowly and then all at once.
This brings to mind individuals who are railing against home prices or index targets comparing the past to the present.
I see statements like this all the time:
- How could this individual in Compton, California be selling this home for $700,000?? He only paid $80,000 for it in 1989! A bubble must be imminent!
- The S&P 500 was only at 2,500 in 2017! We are surely over our skis and headed back to those rational levels any day now.
Meanwhile:
- S&P 500 average EPS is the orange line
- S&P 500 points the blue
macrotrends.net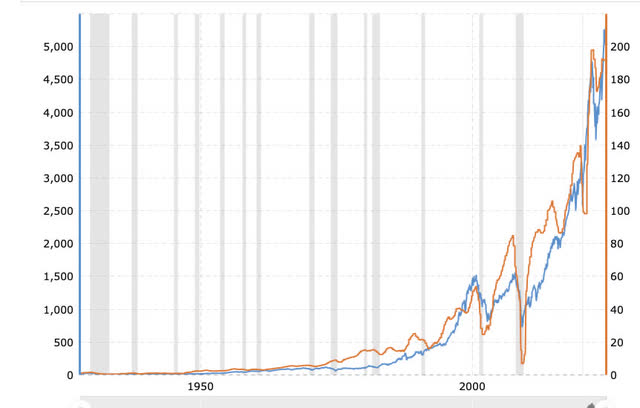
Also, simultaneously, the average rent for a 3-bedroom place in Los Angeles circa 1983 was $710 per month. In 2024, it is $3,263.
Source: LA Almanac.com
Do we notice a trend here? Asset values follow earnings. And regarding tech now being the most profitable slice of our stock market, we aren’t even sure if GAAP P/E ratios are very relevant any longer for that segment. They can turn on and off profitability like a switch, and will do all they can to protect their revenue stream against government taxation. The more money retained within the system, the faster the lake is covered by the lily pad.
Inflation is real, these numbers aren’t just about profitability and growth over time, it is the FED’s objective to create inflation in most economic periods. Stop looking backward. Nostalgia about the past is bad for your financial health.
The new feedback loop is impoverishing us
One of the interesting new actors to the system in our self-fulfilling prophecy is that retirement has become the new goal, not being rich.
- In the 1999 tech bubble, everyone wanted to be a Gordon Gecko tech bro lighting cigars with $100 bills. A rich feeling.
- In the 2008 housing crisis, every bartender wanted to create a house-flipping empire. Everyone could be Donald Trump in their imaginations.
- In 2024, everyone is worried that $3 million is barely enough to simply retire.
There is a mentality of impoverishment among millionaires and even multi-millionaires. Browse the forums of financial independence retire early “FIRE” forums and see the litany of examples of high-paid engineers, doctors, executives and lawyers that now have anywhere from $1-$5 million in investments yet still worry if it’s enough. Every time I feel good about myself, I like to browse forums on Reddit, Mr. Money Mustache, or various “Bogle heads” forums that make me once again feel poor.
While statistics would tell you that worldwide millionaires, even in the low single digit 7 figure category are less than 1.5% of the global population, the comments of the upper echelon get amplified as if they are now the norm. This is leading to individuals staying in the market and adding everything they can. The financial advisors in your ear tell you every year that you haven’t saved enough, send us more, and we’ll make it grow.
This is a new mental illness that is pervasive in my opinion. Never before has society been exposed to everyone else’s wallets and financial backgrounds for open discussion. There will always be someone richer than you, and this new feedback loop is impoverishing you.
What will break this market?
We can see some rotation trends from growth to value, if it sticks is hard to say. The inability to monetize vast AI expenditures could slow down the market growth rate and cause a 10-20% decline. The buzz seems to be, AI might be overhyped and not going to add to the bottom line for many years into the future. The companies discussed would beg to differ, and if AI replaces a lot of operating expenses, it will only make these companies cheaper going forward.
Summary
The market is more about buyers and sellers than it is strictly about fundamentals, I can imagine that these two new actors in the system will throw a wrench into market timer cogs. To recap, the two are:
- SaaS companies are the upper echelon of earners that purposely avoid taxes and by proxy lower their GAAP income.
- An attitude of scarcity leads to asset hoarding, where even multi-millionaires feel poor. This in turn leads to more blind allocations to 401Ks and retirement accounts with higher equity allocations.
I don’t think we are in a bubble, but we are not in a cheap market either. When rate cuts start to occur and the great migration of money market funds takes place, we will then revisit whether we have entered an irrational bubble, even considering the operating leverage of the most profitable tech companies.
Read the full article here