
In this coverage, we conducted a thorough analysis to assess and contrast the performance of the healthcare equipment industry. Specifically, we focused on the top 10 companies within the iShares U.S. Medical Devices ETF (NYSEARCA:IHI), which collectively represent 71% of the total ETF holdings. Our analysis was conducted based on full-year 2022 financials of all companies, and encompassed several key aspects. Firstly, we gathered and scrutinized the performance data of these top companies in terms of revenue growth, as well as their growth projections for the current year, based on management guidance. We then compared these findings with our 3-year forward average forecast derived from previous analyses. Additionally, we examined the changes in the market share of these top companies in the healthcare equipment market to determine any notable trends. Lastly, we evaluated the profitability of these companies and compared them against the industry average to ascertain any competitive advantages they may have.
Better Outlook for Top Companies but Still Facing Challenges
|
Companies |
Q4 2022 TTM Growth % (YoY) |
Analyst Consensus Growth Difference % |
Management Guidance (2023) |
Analyst Consensus (2023) |
Analyst Consensus 3-year Forward Average |
Past 5-year Average Growth |
Our 3-year Forward Average |
|
Thermo Fisher Scientific (TMO) |
14.5% |
2.41% |
0.8% |
0.87% |
5.6% |
16.51% |
4.1% |
|
Abbott Laboratories (ABT) |
1.3% |
0.98% |
-8.6% |
-8.53% |
1.1% |
9.77% |
7.9% |
|
Medtronic (MDT) |
-3.2% |
-0.32% |
– |
4.33% |
4.7% |
0.69% |
5.2% |
|
Stryker Corp (SYK) |
7.8% |
1.31% |
7.8% |
7.05% |
6.9% |
8.19% |
8.4% |
|
Intuitive Surgical Inc (ISRG) |
9.0% |
0.20% |
14.0% |
11.17% |
12.5% |
14.67% |
11.6% |
|
Boston Scientific Corp (BSX) |
6.7% |
0.02% |
7.0% |
6.66% |
7.3% |
6.99% |
8.5% |
|
Becton, Dickinson (BDX) |
1.1% |
0.96% |
6.3% |
1.38% |
4.3% |
8.87% |
5.6% |
|
Edwards Lifesciences Corp (EW) |
2.9% |
0.42% |
10.5% |
8.68% |
9.7% |
9.40% |
13.5% |
|
DexCom Inc (DXCM) |
18.8% |
-0.01% |
17.5% |
19.01% |
19.18% |
32.28% |
– |
|
Idexx Laboratories Inc (IDXX) |
4.7% |
0.22% |
10.0% |
8.54% |
9.56% |
11.33% |
– |
|
Average |
6.4% |
0.62% |
7.2% |
5.92% |
8.08% |
11.87% |
8.09% |
Source: Company Data, Seeking Alpha, Khaveen Investments
In the table above, we compiled the top 10 companies by their weightage of IHI based on their 2022 revenue growth, growth difference to analyst consensus, management guidance obtained from earnings briefings, analyst consensus for 2023, average 3-year forward analyst consensus, past 5-year average growth and our 3-year forward average from previous analyses on companies which we covered previously.
First, starting with the Q4 2022 TTM YoY growth, the top 10 companies’ revenue in IHI grew by 6.4% in 2022, which is lower compared to the average 5-year growth of 11.9%. 5 companies had above-average growth which includes Thermo Fisher Scientific (14.5%), Stryker Corp (7.8%), Intuitive Surgical Inc (9.0%), Boston Scientific Corp (6.7%) and DexCom Inc (18.8%). The actual revenues were relatively in line with analyst expectations, with the actual revenue growth outperforming analyst consensus by only 0.62% in 2022.
On average, the companies (excluding Medtronic) have guided slightly higher growth in 2023 (7.2%) compared to the average growth achieved in 2022 (6.4%). The companies with above-average guidance are Intuitive Surgical Inc (14.0%), Edwards Lifesciences Corp (10.5%), DexCom Inc (17.5%) and Idexx Laboratories (10.0%).
Only Abbott has guided negative growth due to the lower Covid revenue expected. The company guided its Covid revenue in 2023 to be only $400 mln compared to $3.1 bln in 2023. Among the companies, Abbott Laboratories has the lowest analyst consensus growth of -8.53%. Its average analyst revenue consensus and the 3-year forward average are both lower than the company’s historical 5-year average growth of 9.39%.
Additionally, Thermo Fisher also guided lower revenues from vaccines and therapies revenue in 2023 of $500 mln compared to $1.7 bln in the previous year. Only Boston Scientific and Edwards Lifesciences have a slightly higher 3-year average analyst consensus growth than their 5-year historical CAGR.
Furthermore, we compared the top companies in IHI in terms of their revenue growth consensus by analysts in 2023 and their 3-year forward average with their historical 5-year revenue. From the table, the average analysts’ consensus is 5.92% and is lower than the 3-year average forward growth of 8.08%, which highlights a slightly more pessimistic outlook for the year. The average 5-year revenue growth was 11.9%, with DexCom Inc having the highest 5-year CAGR at 32.28% and Medtronic having the lowest 5-year CAGR at just 0.69%.
In comparison, based on our previous analyses of the top 8 companies, we derived an average forward 3-year growth rate of 8.09%. Our forecasts for all companies are higher than their 2023 analyst revenue consensus. Only Thermo Fisher and Intuitive Surgical have higher 3-year forward analyst consensus than our forecasts.
Overall, following a year of slower growth for the top companies within IHI which was below its 5-year historical average, the outlook of these companies is slightly better in 2023 with higher average growth guidance from management but still below the 5-year average as key holdings such as Thermo Fisher and Abbott cited the poor outlook of Covid and vaccine revenues as the cumulative Covid cases appear to have plateaued in 2023 based on Statista.
Positive Market Share Trend of Top Holdings
Company Data, Seeking Alpha, Khaveen Investments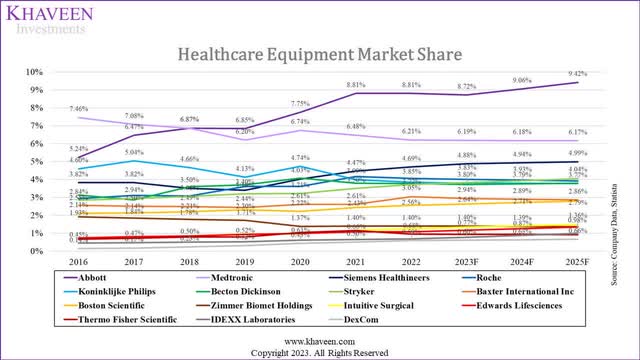
Furthermore, we compiled the market share of the top 15 healthcare equipment companies by revenues in the chart above including the top 10 companies from IHI by weightage. For Thermo Fisher and Roche (OTCQX:RHHBY), we only took their healthcare equipment revenues.
Based on the chart, Abbott remained the market leader of the healthcare equipment market with a share of 8.8% in 2022 which was similar to its share in 2021. Over the past 7 years, Abbott has strengthened its market share and overtook the lead in 2019 as second-placed competitor Medtronic’s share has consistently been on a declining trend except in 2020. Siemens Healthineers (OTCPK:SEMHF) maintained its spot in third place with a 4.69% share has been on an increasing trend in the period. This is followed by Roche and Koninklijke Philips (PHG) which maintained their spots at fourth and fifth respectively but with a slightly lower share compared to 2021.
In relation to IHI specifically, 5 of the top 10 companies are in the top 10 holdings of IHI which are Abbott, Medtronic, Becton Dickinson, Stryker and Boston Scientific. Among these 5 companies, 3 out of the top 5 companies gained share which was Abbott, Stryker and Boston Scientific. These 3 companies have been on a steadily rising trend over the period.
Additionally, the next 5 companies within IHI which are not in the top 10 are Intuitive Surgical, Edwards Lifesciences, Thermo Fisher Scientific, IDEXX Laboratories and DexCom. Except for Thermo Fisher, these companies gained market share in 2022. However, over the entire period, all 5 companies have been gaining market share since 2016, highlighting the superior growth of these companies.
In summary, 7 of the top 10 companies within IHI gained market share in the healthcare equipment market in 2022 which we believe indicates the positive performance of these companies. Moreover, the market shares of companies such as Abbott, Stryker and Boston Scientific, Intuitive Surgical, Edwards Lifesciences, Thermo Fisher Scientific, IDEXX Laboratories and DexCom have been rising over the past 7 years. We expect the top companies in IHI to continue maintaining their positive share gain trend with both our average 3-year forecast (8.09%) and analyst consensus (8%) higher than the medical devices market segment CAGR of 5.5% by Statista.
Stronger Than Industry Profitability Margins
|
Company |
Gross Profit Margin |
Net Income Margin |
FCF Margin |
5-yr Gross Margin |
5-yr Net Margin |
5-yr FCF Margin |
5-yr Forward Gross Margin (Our Forecast) |
5-yr Forward Net Margin (Our Forecast) |
5-yr Forward FCF Margin (Our Forecast) |
|
Thermo Fisher Scientific |
42.3% |
15.5% |
13.0% |
46.6% |
15.9% |
14.1% |
48.9% |
24.1% |
26.8% |
|
Abbott Laboratories |
56.3% |
15.9% |
16.5% |
57.8% |
11.7% |
15.8% |
59.3% |
18.6% |
17.4% |
|
Medtronic |
63.1% |
12.8% |
9.7% |
65.2% |
14.1% |
13.3% |
72.0% |
17.0% |
22.0% |
|
Stryker Corp |
66.7% |
13.2% |
10.5% |
68.2% |
13.9% |
17.2% |
68.1% |
20.0% |
19.8% |
|
Intuitive Surgical Inc |
67.4% |
21.3% |
18.0% |
68.6% |
27.0% |
22.2% |
72.8% |
41.4% |
38.7% |
|
Boston Scientific Corp |
68.4% |
5.5% |
9.1% |
69.9% |
14.7% |
13.3% |
73.0% |
15.4% |
23.7% |
|
Becton, Dickinson |
45.5% |
8.6% |
7.6% |
47.4% |
6.9% |
16.4% |
48.1% |
11.0% |
16.3% |
|
Edwards Lifesciences Corp |
80.0% |
28.3% |
17.3% |
75.6% |
22.5% |
14.1% |
78.5% |
31.9% |
26.6% |
|
DexCom Inc |
64.72% |
11.73% |
8.00% |
65.57% |
6.82% |
0.75% |
– |
– |
– |
|
Idexx Laboratories Inc |
59.52% |
20.17% |
9.75% |
57.59% |
19.42% |
13.39% |
– |
– |
– |
|
Average |
61.4% |
15.3% |
11.9% |
62.2% |
15.3% |
14.1% |
65.1% |
22.4% |
23.9% |
Source: Company Data, Khaveen Investments
In the table above, we compiled the profitability margins of the top 10 holdings of IHI to analyze their profitability in terms of gross, net and FCF margins based on TTM and 5-year historical average as well our 5-year forward margins forecasts for the top 8 companies.
As seen in the table, the profitability of the top companies is positive for gross profit, net profit, and FCF margins. The average TTM gross margin is 61.4% and net margin average is 15.3%. More importantly, its FCF margins were positive with an average of 11.9%. The company with the strongest gross margin in 2022 was Edwards Lifesciences at 80% and was also the company with the highest net margin of 28.3%. In terms of FCF margins, Intuitive Surgical has the highest FCF margins of 18% followed by Edward Lifesciences.
In comparison to the 5-year averages, the average gross margins were slightly lower than the 5-year average of 62.2% vs 60.9%. The average FCF margins were also lower at 11.1% compared to the 5-year average of 14.1%. The average net margins were in line with the 5-year average at 15%
For our 5-year forward averages compiled from previous analyses, on average, we see the average gross margins increase to 62.4% as we expect these companies to have positive growth and expand their scale. Based on Abbott’s annual report, the company highlighted its increase in gross margins “reflects the effects of higher sales volume, higher manufacturing utilization”. Additionally, we see the average net margins increasing to 22.4% supported by gross margin improvements and lower operating costs as a % of revenue and FCF margins rising to 23.9% as revenue growth outpaced capex growth. For example, Abbott’s capex as a % of revenue had decreased from 9.4% to 4.4% in the past 10 years.
|
Symbol |
Gross Profit Margin |
Net Income Margin |
FCF Margin |
|
Top 10 IHI Holdings |
61.4% |
15.3% |
11.9% |
|
Industry Average |
63.5% |
4.0% |
7.9% |
Source: Company Data, Khaveen Investments
Furthermore, we then compared the average profit margins for the top holdings of IHI with the average healthcare equipment margins for companies larger than a market cap of $2 bln. Based on the table, the average industry gross margins are slightly higher compared to the top companies in IHI. However, the top companies have a much stronger net margin of 15.3% compared to the industry average of 4% which highlights the greater scale of the top companies in IHI as evidenced by its high combined market share of 30% for the top 10 holdings of IHI from the previous point. Also, the average FCF margins of 11.9% for the top companies are higher than the industry average of 7.9%.
To conclude, we determined that the profitability of the top companies of IHI to be fairly stable with strong profit margins in the past 5 years and we forecasted the average gross, net and FCF margins to continue rising as we see their positive revenue growth outlook supporting their scale expansion. Moreover, we determined the top companies have greater profitability compared to the industry average with higher net and FCF margins, which we believe is due to their larger scale (30% combined market share for top 10 companies).
Risk: Lower Growth Outlook of Key Holdings
The top healthcare equipment companies guided a slightly better growth outlook in 2023 but still lower than their 5-year averages. For example, Abbott guided negative growth due to lower Covid revenue expected in 2023 to be only $400 mln compared to $3.1 bln in 2023. Additionally, Thermo Fisher also guided lower revenues from vaccines and therapies revenue in 2023 of $500 mln compared to $1.7 bln in the previous year as explained in the first point. This is significant as these two companies are the two largest holdings in IHI accounting for 30% of the total ETF weighting.
Verdict
Seeking Alpha, Khaveen Investments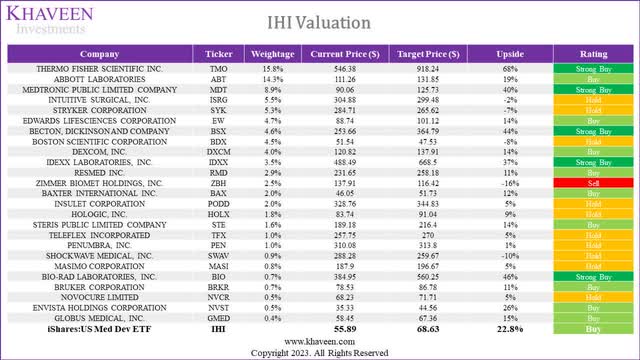
For the valuation of IHI, we compiled our price targets from previous analyses for the companies on which we had previous coverage. For all other companies, we based their price targets on analyst consensus. The chart above shows the top 25 companies in IHI. Overall, we derived a weighted average upside of 22.8% for IHI. Out of a total of 46 companies, the number of companies with at least a Buy rating is 32 or 68% of total whereas the number of companies with a Hold is 14 or 30% of the total.
In conclusion, the IHI ETF’s top holdings are significantly concentrated, with only 10 companies representing 71% of the total breakdown, in contrast to other ETFs such as XHE, where the top 10 account for only 18% of the total. After a year of slower growth for the top companies within IHI, which fell below its 5-year historical average, the outlook for these companies appears to be slightly better in 2023, with higher average growth guidance from management, albeit still below the 5-year average.
Also, we note that seven of the top 10 companies within IHI gained market share in the healthcare equipment market in 2022, indicating positive performance. We anticipate that the top companies could continue to maintain their positive share gain trend, with both our average 3-year forecast (8.09%) and analyst consensus (8%) being higher than the medical devices market segment CAGR of 5.5%. Additionally, the profitability of the top companies has been relatively stable, with strong profit margins over the past five years and we forecasted that the average gross, net, and FCF margins to continue to rise as we expect their positive revenue growth outlook to support scale expansion. Moreover, we found that the top companies exhibit greater profitability compared to the industry average, with higher net and FCF margins, which we believe is due to their large scale as the top 10 holdings have a combined market share of 30%. Based on our valuation, we rate IHI as a Buy with a weighted average price target of $68.63.
Read the full article here