
The stock market, as measured by the S&P 500 Index
SPX,
has continued to remain in a narrow range since early April. That trading range is bounded by 4050 on the downside and 4200 on the upside. In the past two weeks, SPX has traded in an even tighter range, hovering almost exactly at the 20-day moving average of the index; neither side of the trading range has been tested recently.
This type of action has produced mixed signals from our internal indicators, as they can swing from a positive state to a negative state with abandon (breadth is a prime example). There is an even larger trading range in effect, and it has been there for all of this year: from roughly 3800 on the downside to 4200 on the upside. These ranges are marked by horizontal red lines on the accompanying SPX chart.
There doesn’t seem to be the fundamental catalyst many had hoped for that would break SPX out of this trading range. Even the debt ceiling isn’t much of a big deal, after it appears that both sides are willing to negotiate. We’ll see if that holds up.
The McMillan Volatility Band (MVB) buy signal is technically still in effect. The original buy signal was generated on March 16th, though, so this signal is two months old. The target is for SPX to reach its +4σ “modified Bollinger Band,” but that has not happened (it did touch the +3σ Band several times, though). It is probably time to call off this signal, taking the profit that does exist, and wait for a new one to set up.
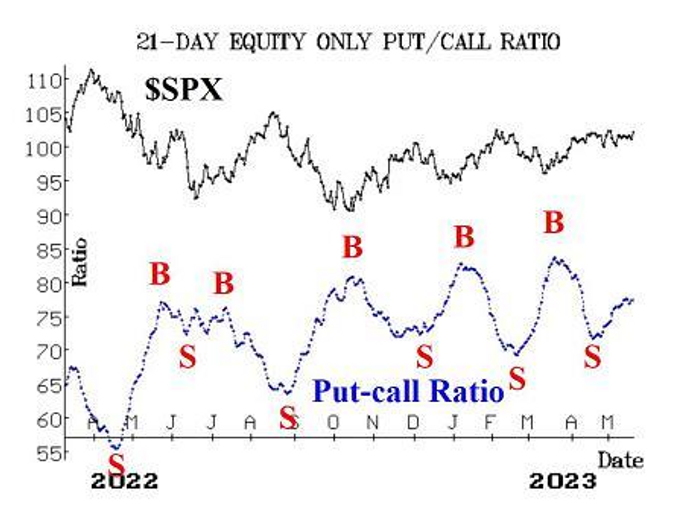
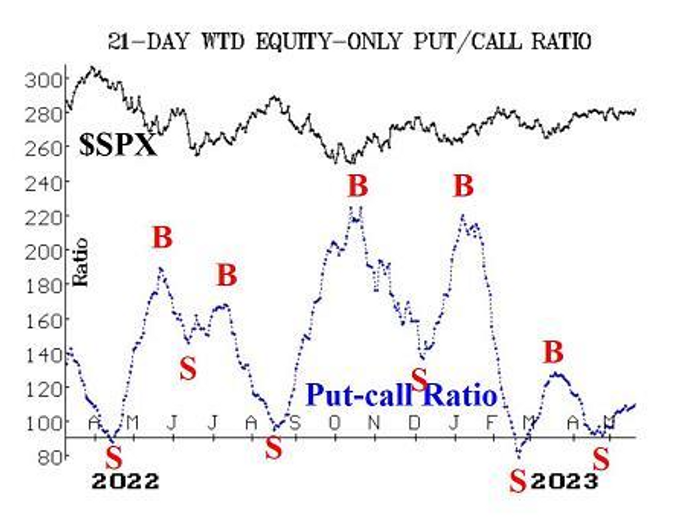
Equity-only put-call ratios have wavered a bit recently, but both are still on sell signals at the current time. Those sell signals are confirmed by the computer programs that we use to analyze these charts. The bottom line is that these ratios are still rising (albeit not as rapidly as they were a couple of weeks ago), and as long as that is the case, they will remain on sell signals.
Breadth has been all over the place. There have been a few highly negative days of breadth, which led to an oversold condition at the close on May 16th. But the large rally and positive breadth on May 17th has rolled both breadth oscillators over to buy signals. Since this indicator is subject to whipsaws, we generally require a two-day confirmation of any signal change before considering taking a new position.
New 52-week lows on the NYSE have been outpacing new highs every day. There have not been a lot of new lows (although on May 16th there were more than 100), but there have been enough to keep this indicator negative.
The volatility “space” has remained bullish in its outlook for stocks. VIX
VIX,
has remained subdued, hovering near 17. That means that the “spike peak” and trend of VIX buy signals remain in place. A VIX burst upward over 21.33 would stop out the “spike peak” signal, and a move above the 200-day moving average (currently at 22.70 and falling) would stop out the trend of VIX signal. Neither seems imminent at this time.
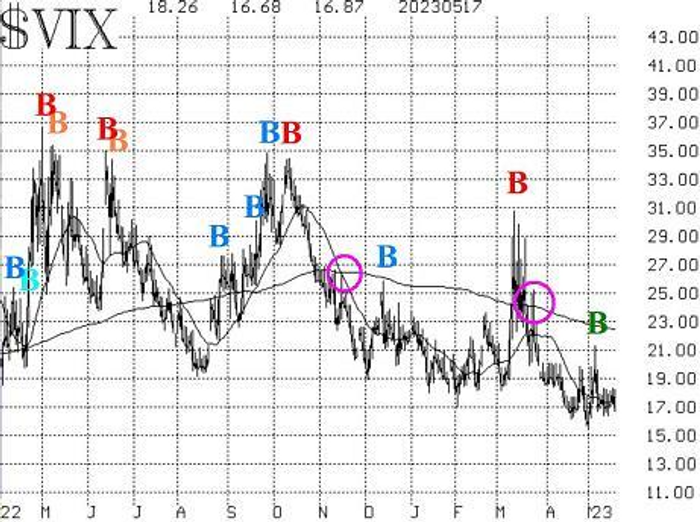
The construct of volatility derivatives remains modestly bullish in its outlook for stocks, as well. June is now the front month and we will be watching the relationship between June and July for signs of negative change. That is, June VIX futures rising above the price of July VIX futures would be a sharply negative sign for stocks. But right now, July is trading above June, so everything is bullish on that front. Moreover, the term structure of the VIX futures slopes upward out through October, and the term structure of the CBOE Volatility Indices slopes upward, too. All those things add up to a positive view of the stock market.
In summary, due to the trading range of SPX, we are not holding a “core” position at this time. A breakout of the range would likely generate a momentum trade in that direction, although even that cannot be taken for granted, since we have seen a couple of false upside breakouts in the last 18 months. We will continue to trade signals from our individual internal indicators when they occur. More aggressive traders might attempt to trade the range by buying SPY puts when SPX approaches 4200 and buying SPY calls when SPX approached 4050.
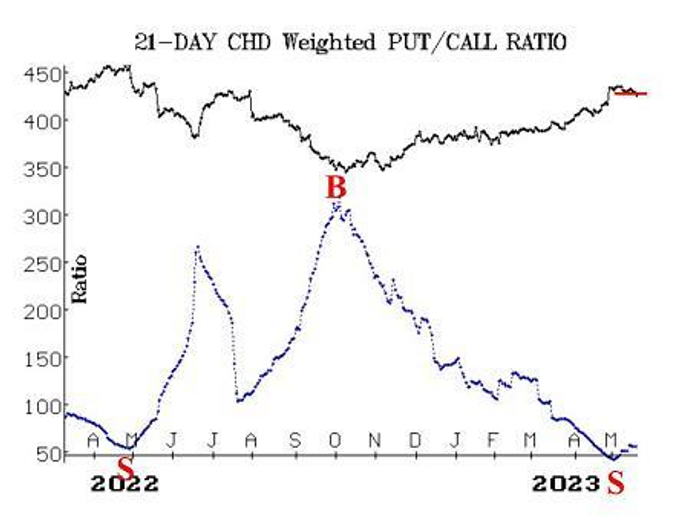
New Recommendation: Church & Dwight (CHD)
There has been a new weighted put-call ratio sell signal in CHD
CHD,
and it has been confirmed technically by the fact that the stock has closed below support at 95.50.
Buy 3 CHD July (21st) puts in line with the market.
CHD: 94.79 July (21st) put: 2.25 bid, offered at 2.40
We will hold this position as long as the put-call ratio remains on a sell signal.
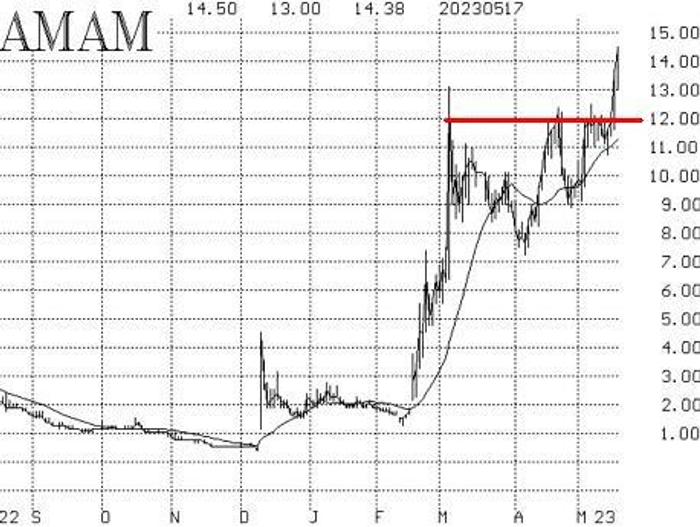
New Recommendation: Ambrx Biopharma (AMAM)
This a purely technical recommendation, based on the fact that AMAM
AMAM,
has broken upward to a 16-month high. Stock volume patterns are strong, and there should be support near the recent triple tops in the 12 area.
Buy 3 AMAM June (16th) 12.5 calls in line with the market.
AMAM: 14.35 June (16th) 12.5 calls: 2.80 bid, offered at 3.20
Stop out on a close below 10.80 by AMAM common.
Follow-Up Action:
All stops are mental closing stops unless otherwise noted.
We are using a “standard” rolling procedure for our SPY spreads: in any vertical bull or bear spread, if the underlying hits the short strike, then roll the entire spread. That would be roll up in the case of a call bull spread, or roll down in the case of a bear put spread. Stay in the same expiration and keep the distance between the strikes the same unless otherwise instructed.
Long 1 expiring SPY May (19th) 410 call and Short 1 SPY May (19th) 425 call: This position was bought in line with the MVB buy signal of March 16th. It was rolled up 15 points on each side, when SPY
SPY,
traded at 410 on April 3rd. We are exiting this spread now, since the signal is really quite “stale.” In some cases, the MVB buy signal doesn’t reach the +4σ Band, and this is apparently one of them.
Long 4 NDAQ Jun (16th) 55 calls: Sell NDAQ
NDAQ,
calls now, since the put-call ratio has begun to rise again, thus canceling out the previous buy signal.
Long 400 JFIN: Raise the stop on JFIN
JFIN,
to 4.75.
Long 1 SPY June (16th) 409 put and Short 1 SPY June (16th) 379: This position was based on the sell signals from the equity-only put-call ratios that occurred in late April. We will hold this position until the equity-only put-call ratios roll over and begin to decline.
Long 1 SPY June (16th) 409 put and Short 1 SPY June (16th) 379: This position was based on the sell signal from realized volatility, since the 20-day Historical Volatility (HV20) of SPX has risen back above 10%. This position will be stopped out if HV20 falls back to 9% or lower; it currently is at 14%.
Long 4 BWA June (16th) 42.5 puts: Continue to hold.
Long 1 SPY June (16th) 411 call and Short 1 SPY June (16th) 425 call: This spread was bought in line with the VIX “spike peak” buy signal of May 5th. Stop out of this position if VIX closes above 21.33. Otherwise, we will exit after holding for 22 trading days.
Send questions to: [email protected].
Lawrence G. McMillan is president of McMillan Analysis, a registered investment and commodity trading advisor. McMillan may hold positions in securities recommended in this report, both personally and in client accounts. He is an experienced trader and money manager and is the author of the best-selling book, Options as a Strategic Investment. www.optionstrategist.com
©McMillan Analysis Corporation is registered with the SEC as an investment advisor and with the CFTC as a commodity trading advisor. The information in this newsletter has been carefully compiled from sources believed to be reliable, but accuracy and completeness are not guaranteed. The officers or directors of McMillan Analysis Corporation, or accounts managed by such persons may have positions in the securities recommended in the advisory.
Read the full article here